
GDP: Quantifying SA’s economic performance in 2020
Stats SA’s Gross domestic product (GDP) release for the fourth quarter of 2020 (October–December) concludes the series for the year, providing a sobering overview of 2020.
Manufacturing and trade help lift growth in the fourth quarter
The economy grew by 1,5% in the fourth quarter, giving an annualised1 growth rate of 6,3%. This follows the revised 13,7% (annualised: 67,3%) rise in economic activity recorded in the third quarter.
Eight of the ten industries made positive gains in the fourth quarter, most notably manufacturing (bolstered by increased production in food, beverages and motor vehicles) and trade (driven by retail, motor trade, catering and accommodation). Mining and finance, real estate and business services were the two industries that recorded a decline in economic activity.
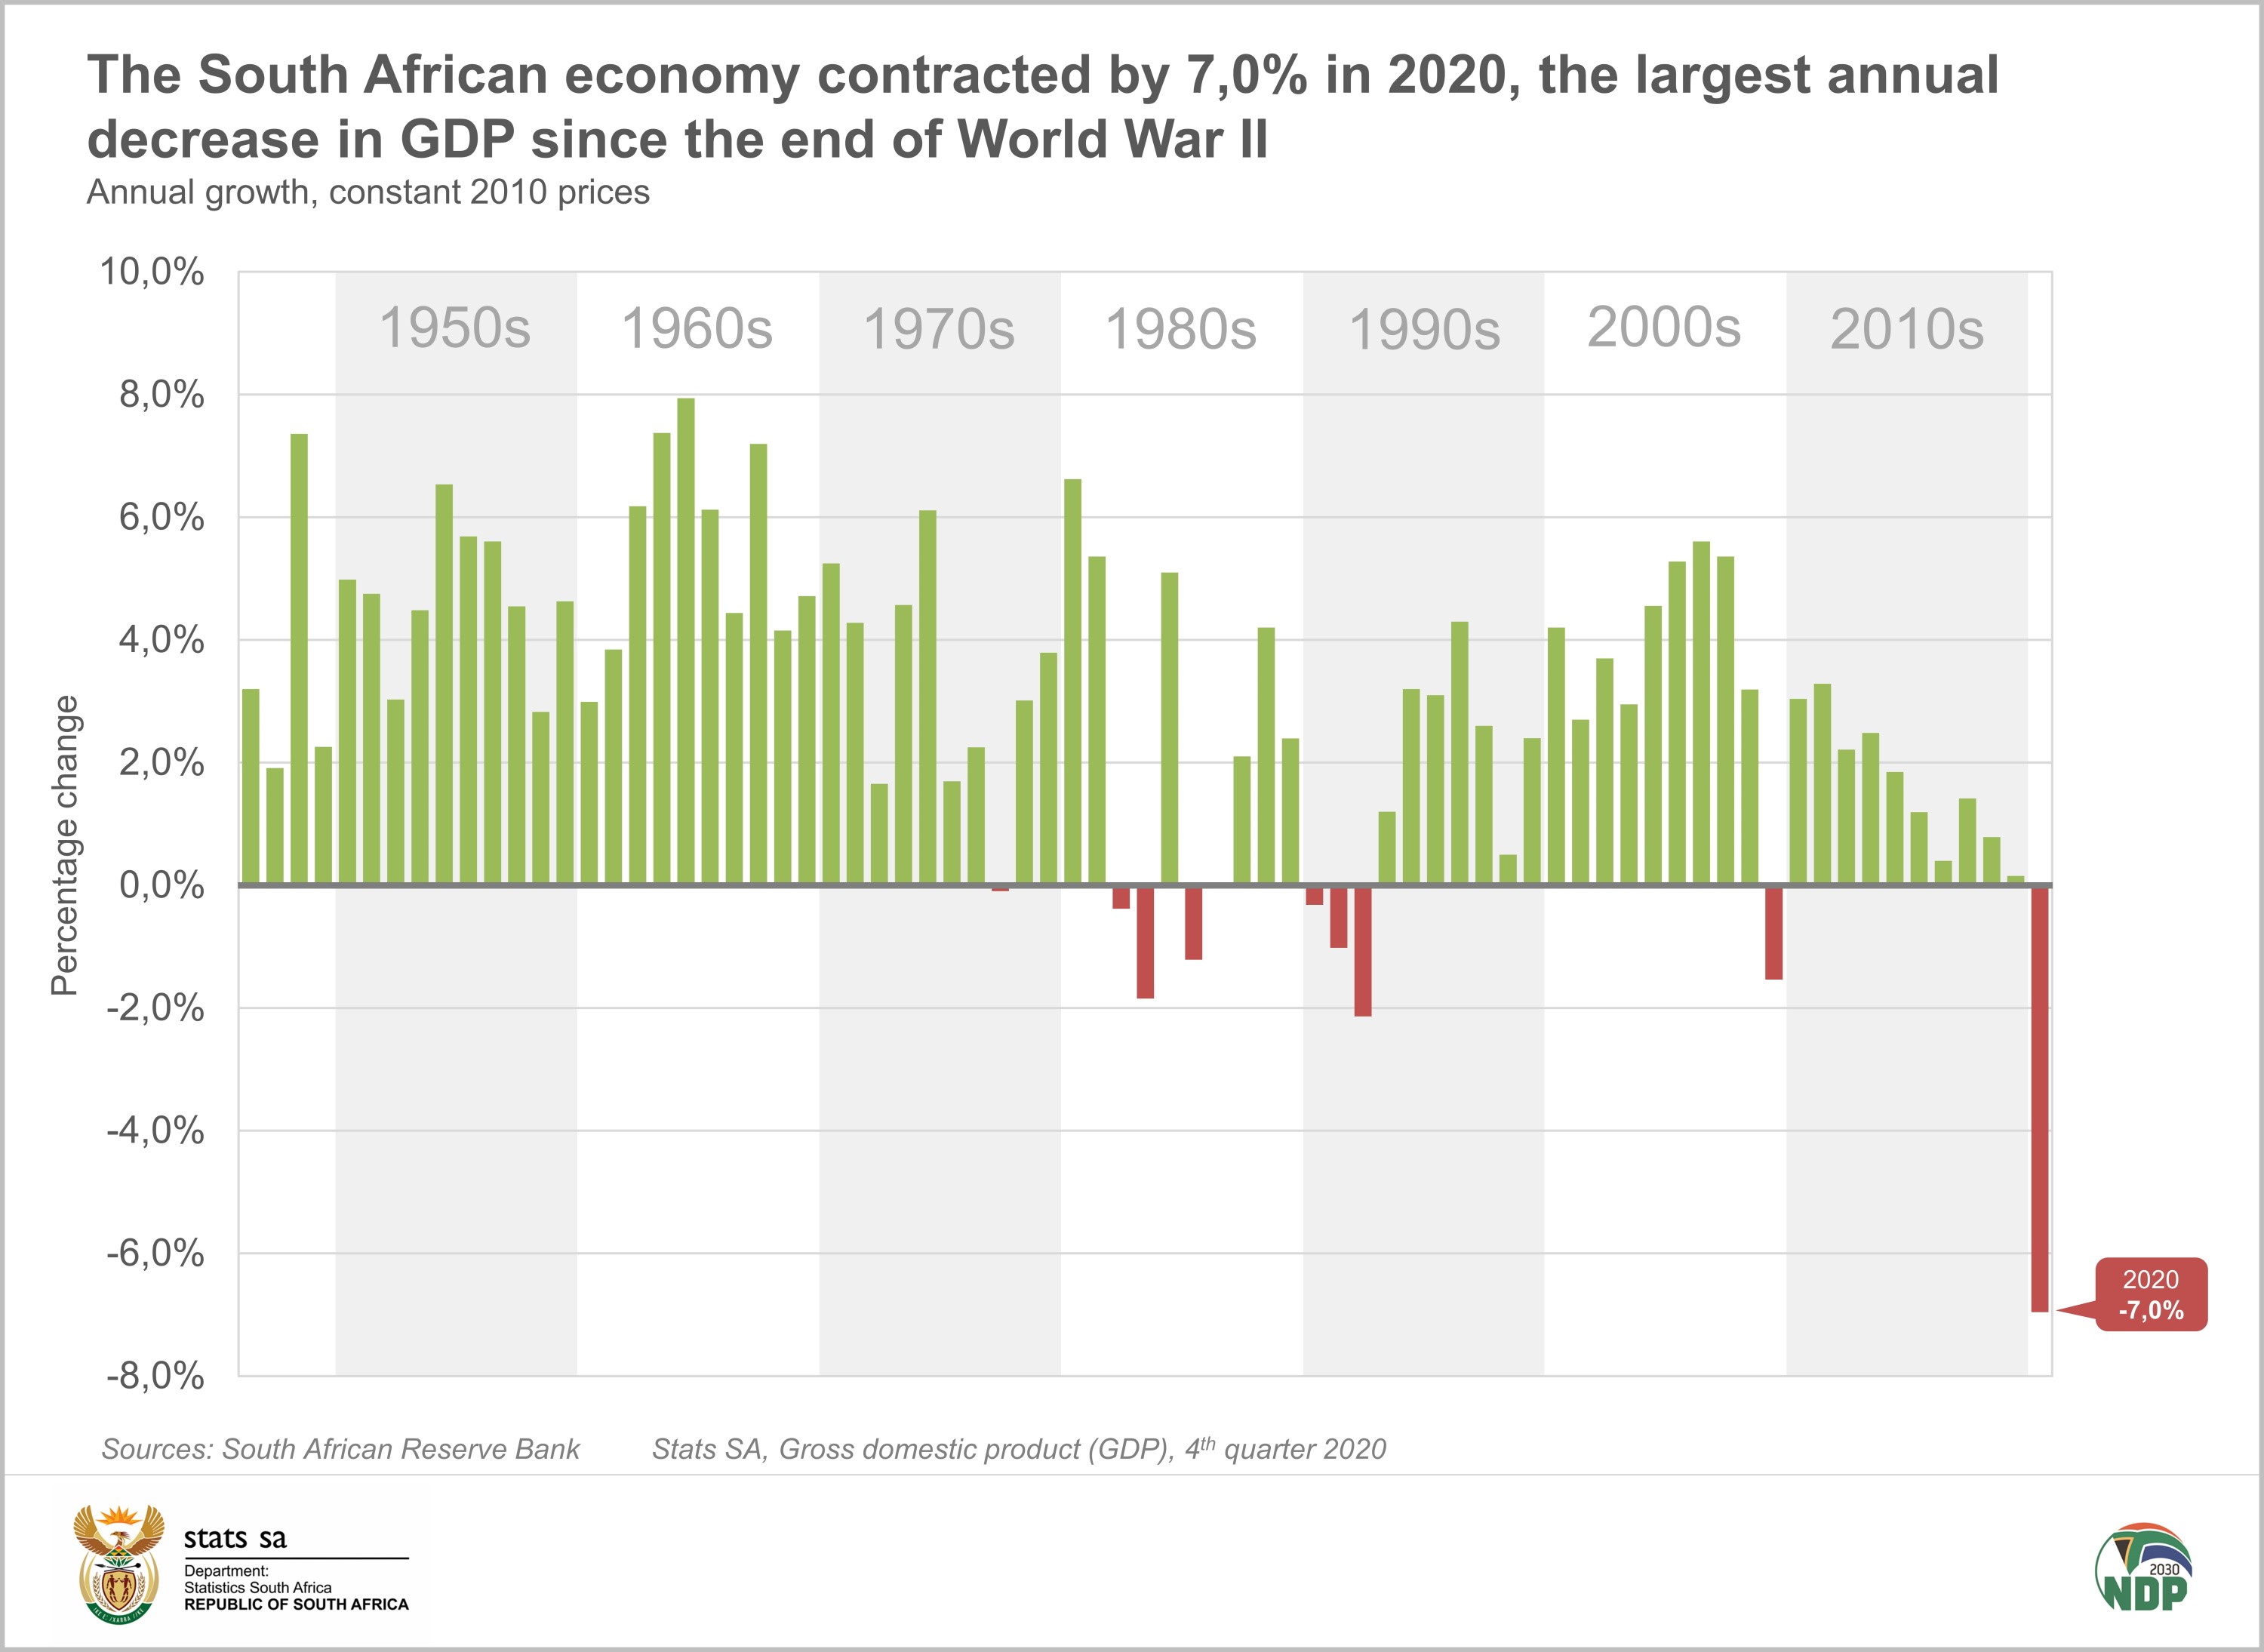
The economy slumped by 7,0% in 2020
The positive growth recorded in the third and fourth quarters was not enough to offset the devastating impact of COVID-19 in the second quarter when lockdown restrictions were at their most stringent. Economic activity for the entire year decreased by 7,0% in 2020 compared with 2019.
If we explore the historical data, this is the biggest annual fall in economic activity the country has seen since at least 1946.2
To provide some perspective, the second biggest fall was recorded in 1992 when the economy contracted by 2,1%, as illustrated in the chart below. At that time, the country was struggling through a two-year-long recession, mainly the result of a global economic downturn. During the 2008/09 global financial crisis, the economy shrank by 1,5% in 2009.
In real terms, if we adjust the figures to take account of inflation, the economy is now at about the same size as it was in 2012 (constant 2010 prices).
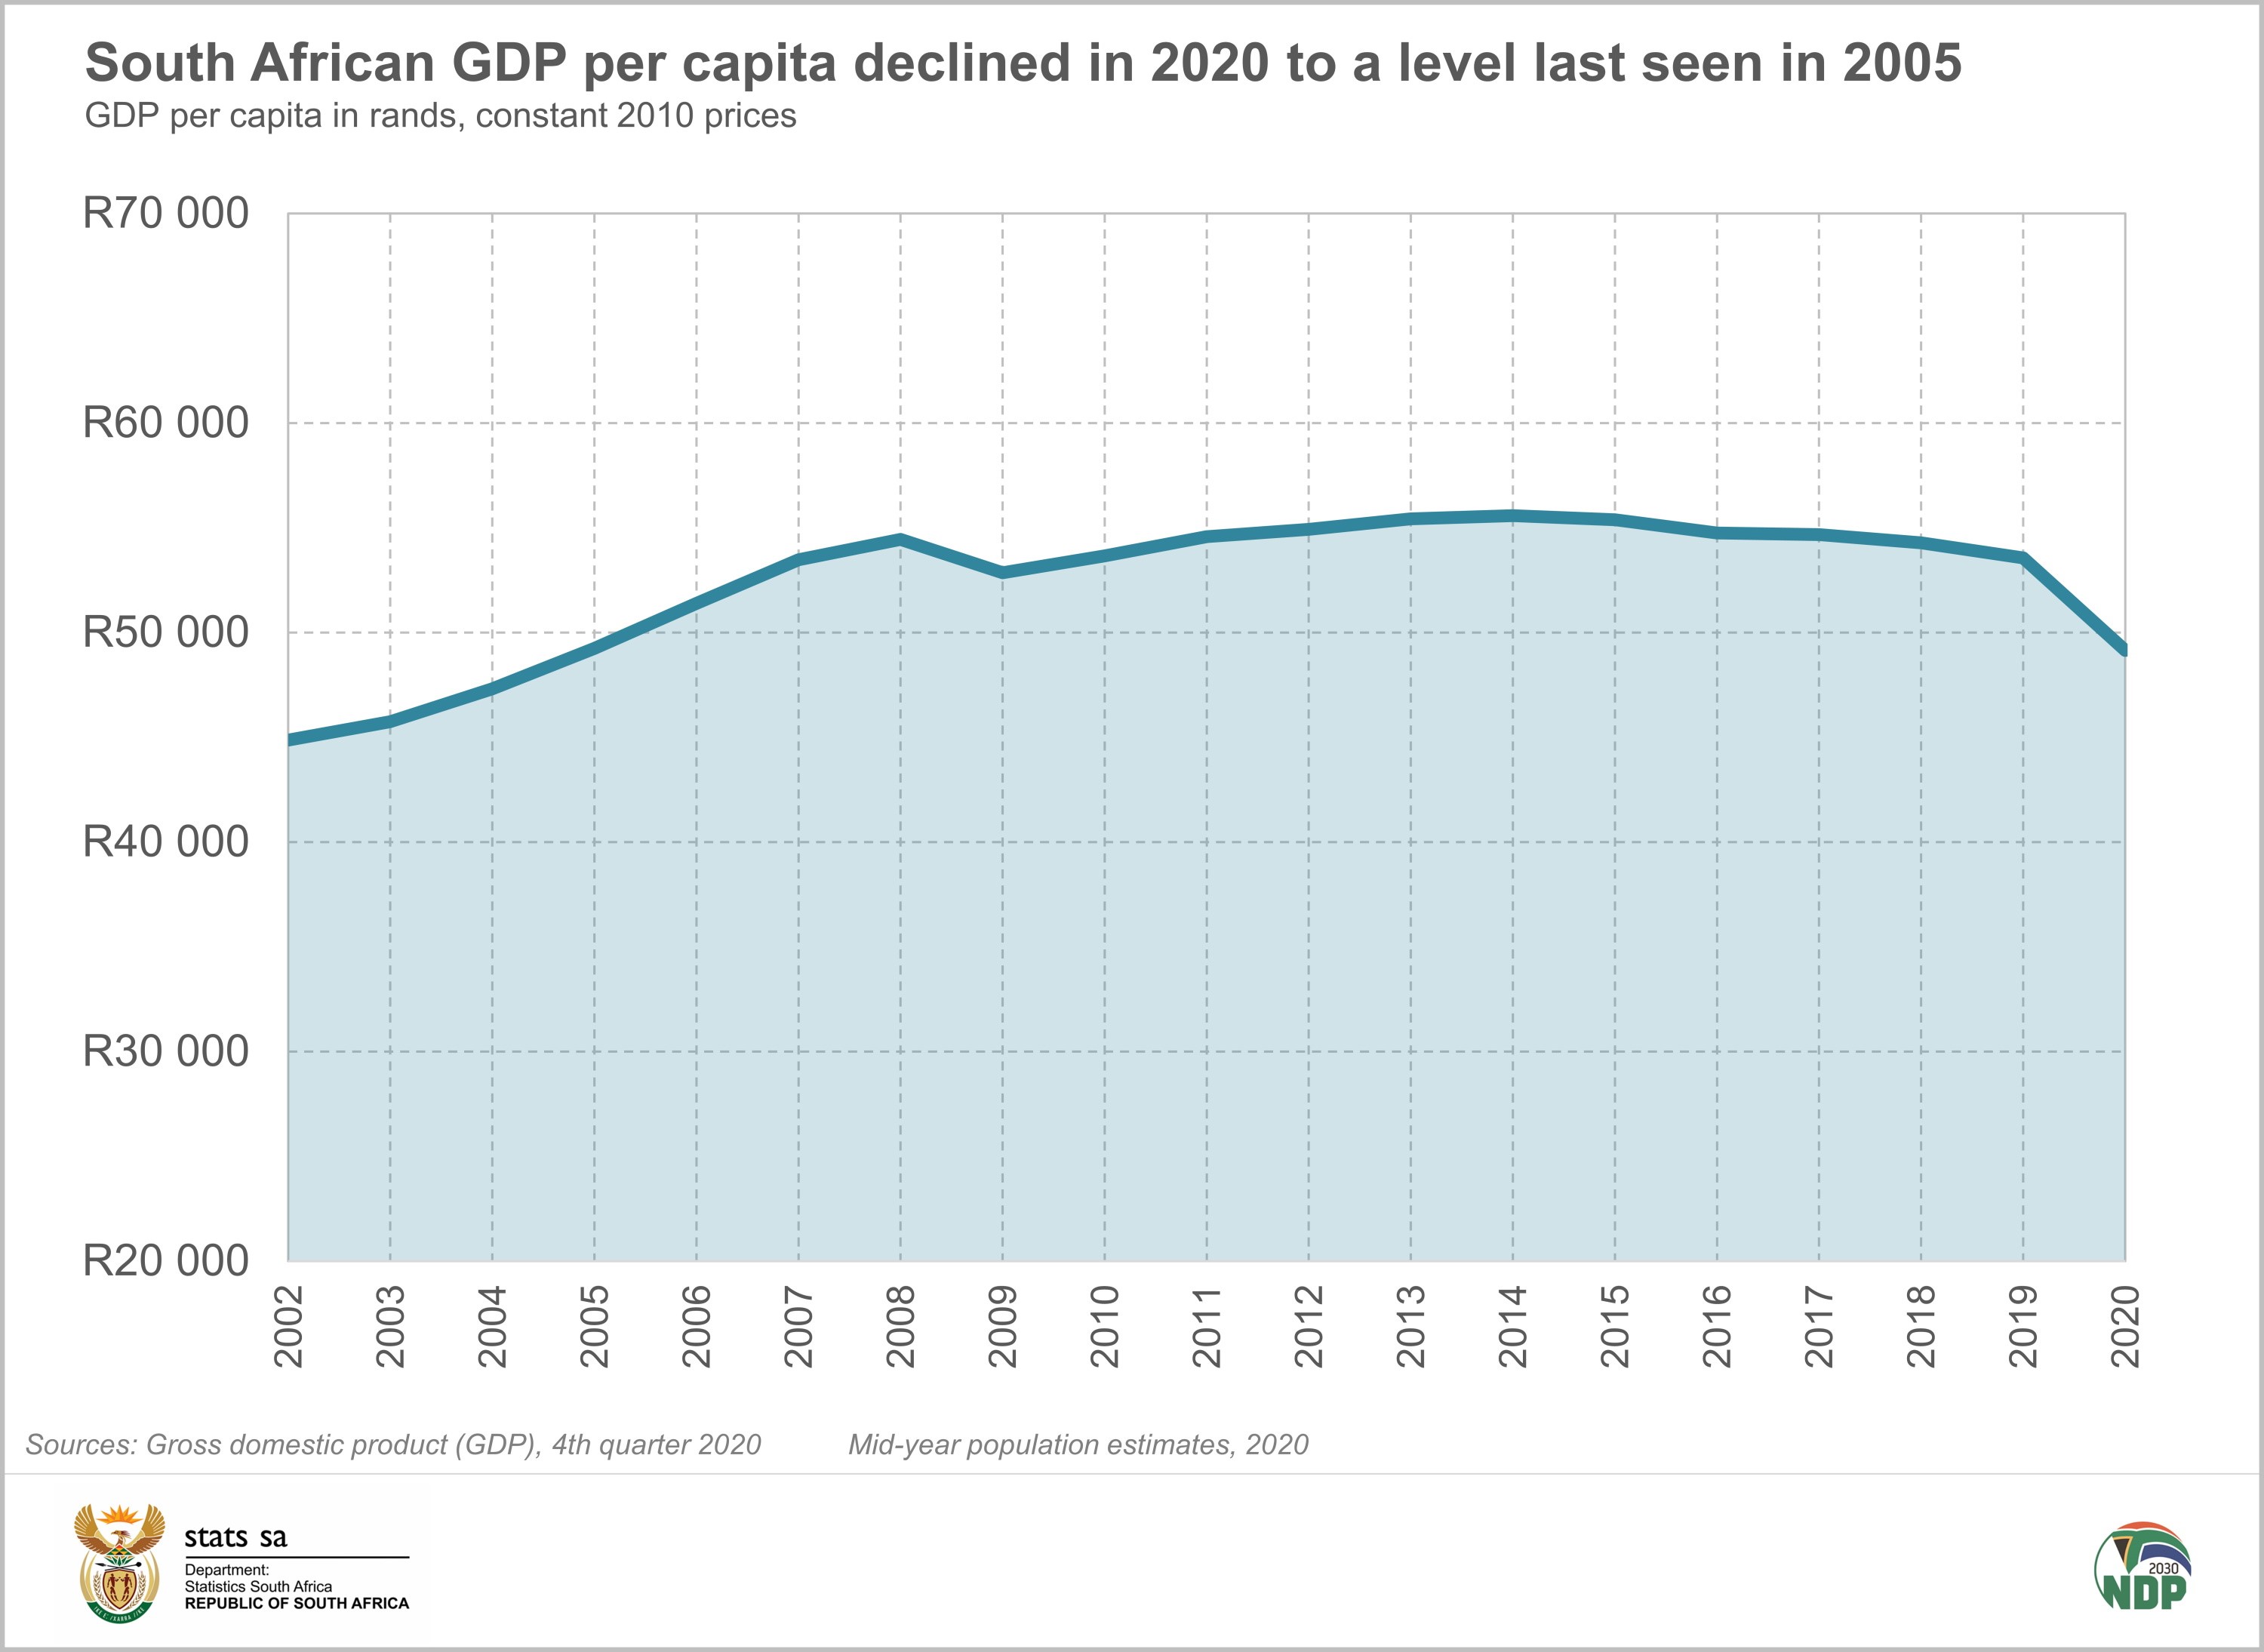
We have a smaller GDP with a larger population
What does this mean for the wellbeing of everyone in the country? This is a complex question to answer, but a rough, quick measure is available in the form of GDP per capita. This represents the size of South Africa’s economy divided by the number of people who live in the country. It is a broad measure often used to make comparisons between countries regarding average living standards.
Again adjusting for inflation, GDP per capita peaked in 2014 and has since been declining. This means that economic growth has been struggling to keep up with population growth. GDP per capita decreased in 2020 to a level last seen in 2005.
Agriculture flourished in 2020
Despite the impact of the pandemic on economic growth, there was one shining star in 2020. Agriculture escaped the effects of the pandemic relatively unscathed, expanding production by 13,1% in 2020. Government also grew marginally in the year, up by 0,7%.
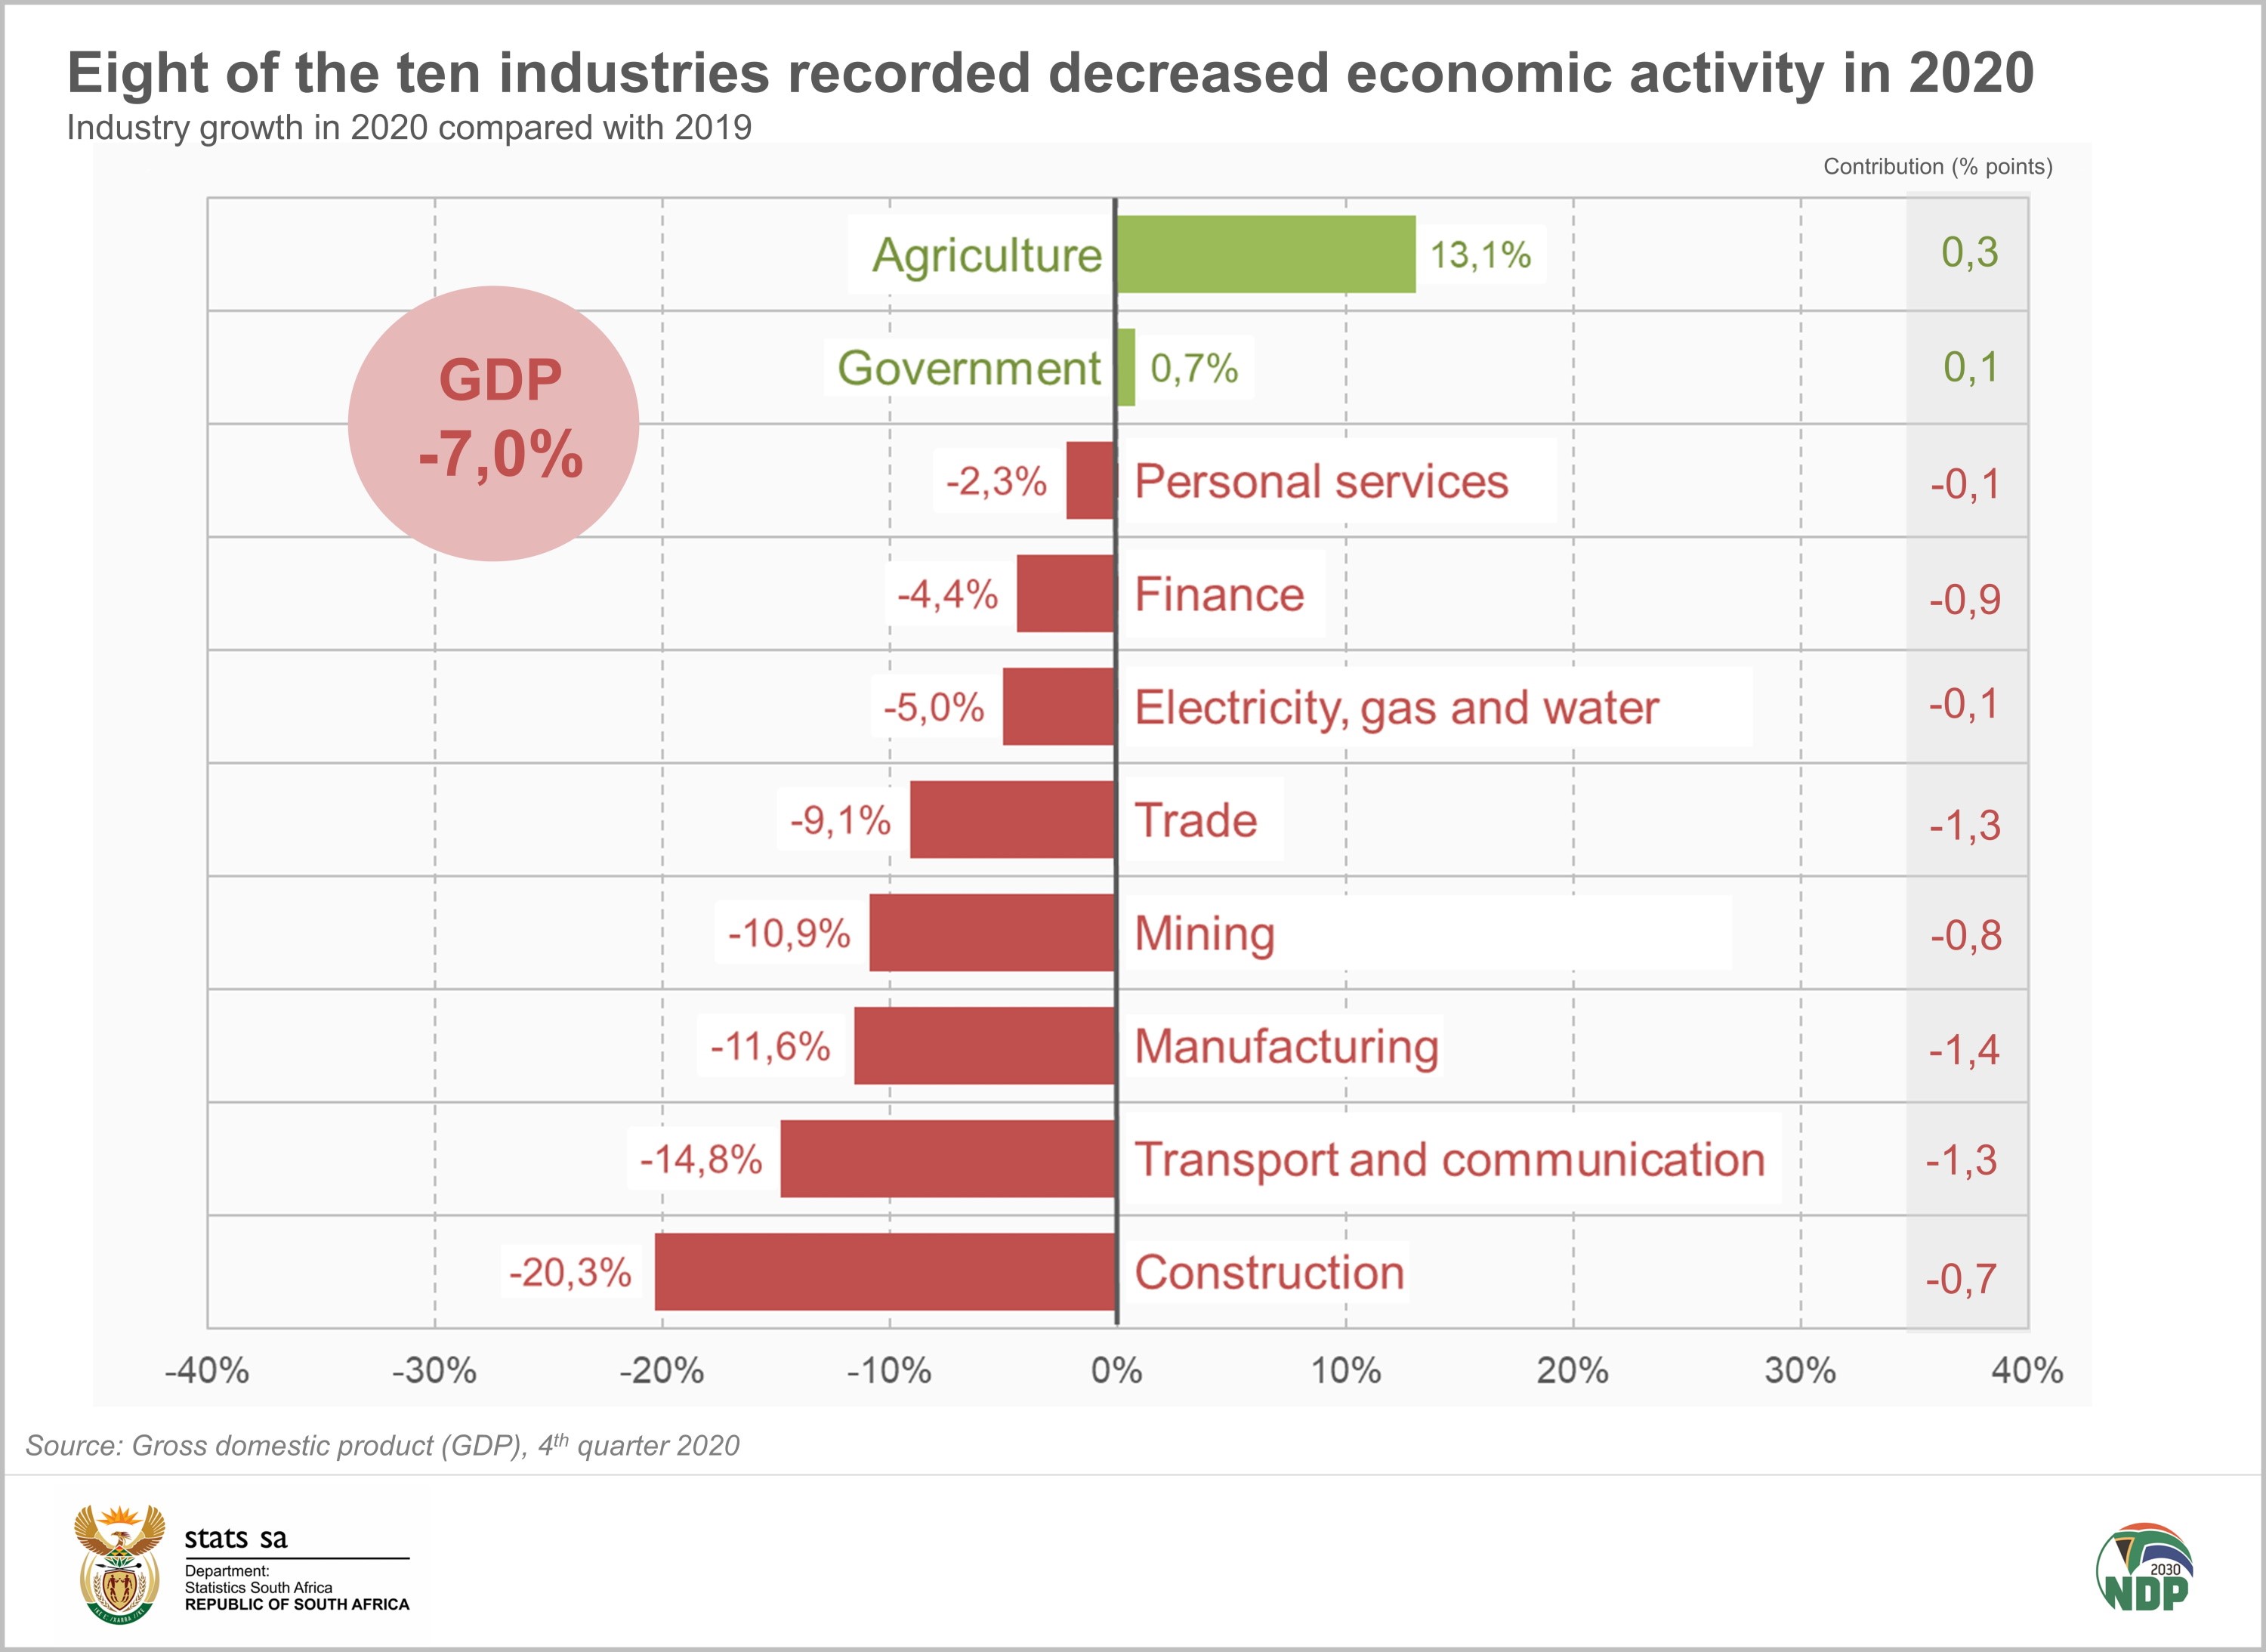
All other industries were pummelled. The construction industry, already in deep trouble before the pandemic, contracted by 20,3%. This marks the industry’s fourth consecutive year of economic decline.
As reported in our article covering the GDP results for the second quarter3, a decline in air travel contributed to the contraction in the transport and communication industry. Rail and road freight operators also found themselves hamstrung by restrictions placed on the production and movement of various goods during the second quarter.
Despite a strong showing in the fourth quarter, manufacturing production was down for the entire year, falling by 11,6%. This was mostly due to work stoppages in the second quarter and a fall in the demand for steel, amongst other reasons.
For more information, download the GDP release, media presentation and the associated Excel files here.
1 An annualised growth rate shows what growth would be over a full year if the quarter-on-quarter growth rate were to occur four times in succession.
2 Historical growth figures are available from the South African Reserve Bank. Historic macroeconomic information, Gross domestic product at market prices, annual growth (KBP6006Z) (access the data here).
3 Stats SA, Steep slump in GDP as COVID-19 takes its toll on the economy (read here).
Similar articles are available on the Stats SA website and can be accessed here.
For a monthly overview of economic indicators and infographics, catch the latest edition of the Stats Biz newsletter here.