
Measuring the progress of development in SA
The General Household Survey, 2019, which tracks the progress of development and identifies persistent service delivery gaps in South Africa, was recently released by Statistics South Africa. Now in its eighteenth year, the survey has yielded a rich set of information across a wide variety of fields such as education, health, disability, social security, housing, energy, access to and use of water and sanitation, environment, refuse removal, telecommunications, transport, household income, access to food, and agriculture.
Let us look at some of the most significant findings from the report.
Household composition and living arrangements
Approximately one-quarter (23,4%) of households consisted of a single person, while six-tenths (60,7%) had fewer than four members. North West had the highest incidence of single person households (28,3%) while households that contained more than six members were most common in KwaZulu-Natal (18,9%) and Mpumalanga (18,3%).
Nuclear households that are comprised of parents and children made up 39,9% of all households. The survey shows that 40,1% of households consisted of two generations while 14,7% contained at least three generations.
The survey shows that 41,8% of households were headed by females, One-half of all households in Eastern Cape were headed by females.
Education
Almost four-tenths (36,8%) of the 0–4-year-olds attended Early Childhood Development(ECD) programmes and access to these facilities was highest in Gauteng (46,8%) and Western Cape (46,9%). One-half (50,2%) of children aged 0-4 years stayed at home with parents or guardians.
There were approximately 14,6 million learners at school in 2019. Participation in education institutions was virtually universal (96,6%) by the age of 15 years (the last compulsory school age). Approximately two-thirds (64,3%) of learners were still in school by the age of 18 which usually represents the age at which learners exit grade 12. Almost one-quarter (24,3%) of twenty-year olds were still attending secondary school.
While the percentage of learners who have achieved grade 12 has been increasing, the survey shows that the percentage of individuals who attended post-school education has remained relatively low for youth aged 19 to 22 years of age.
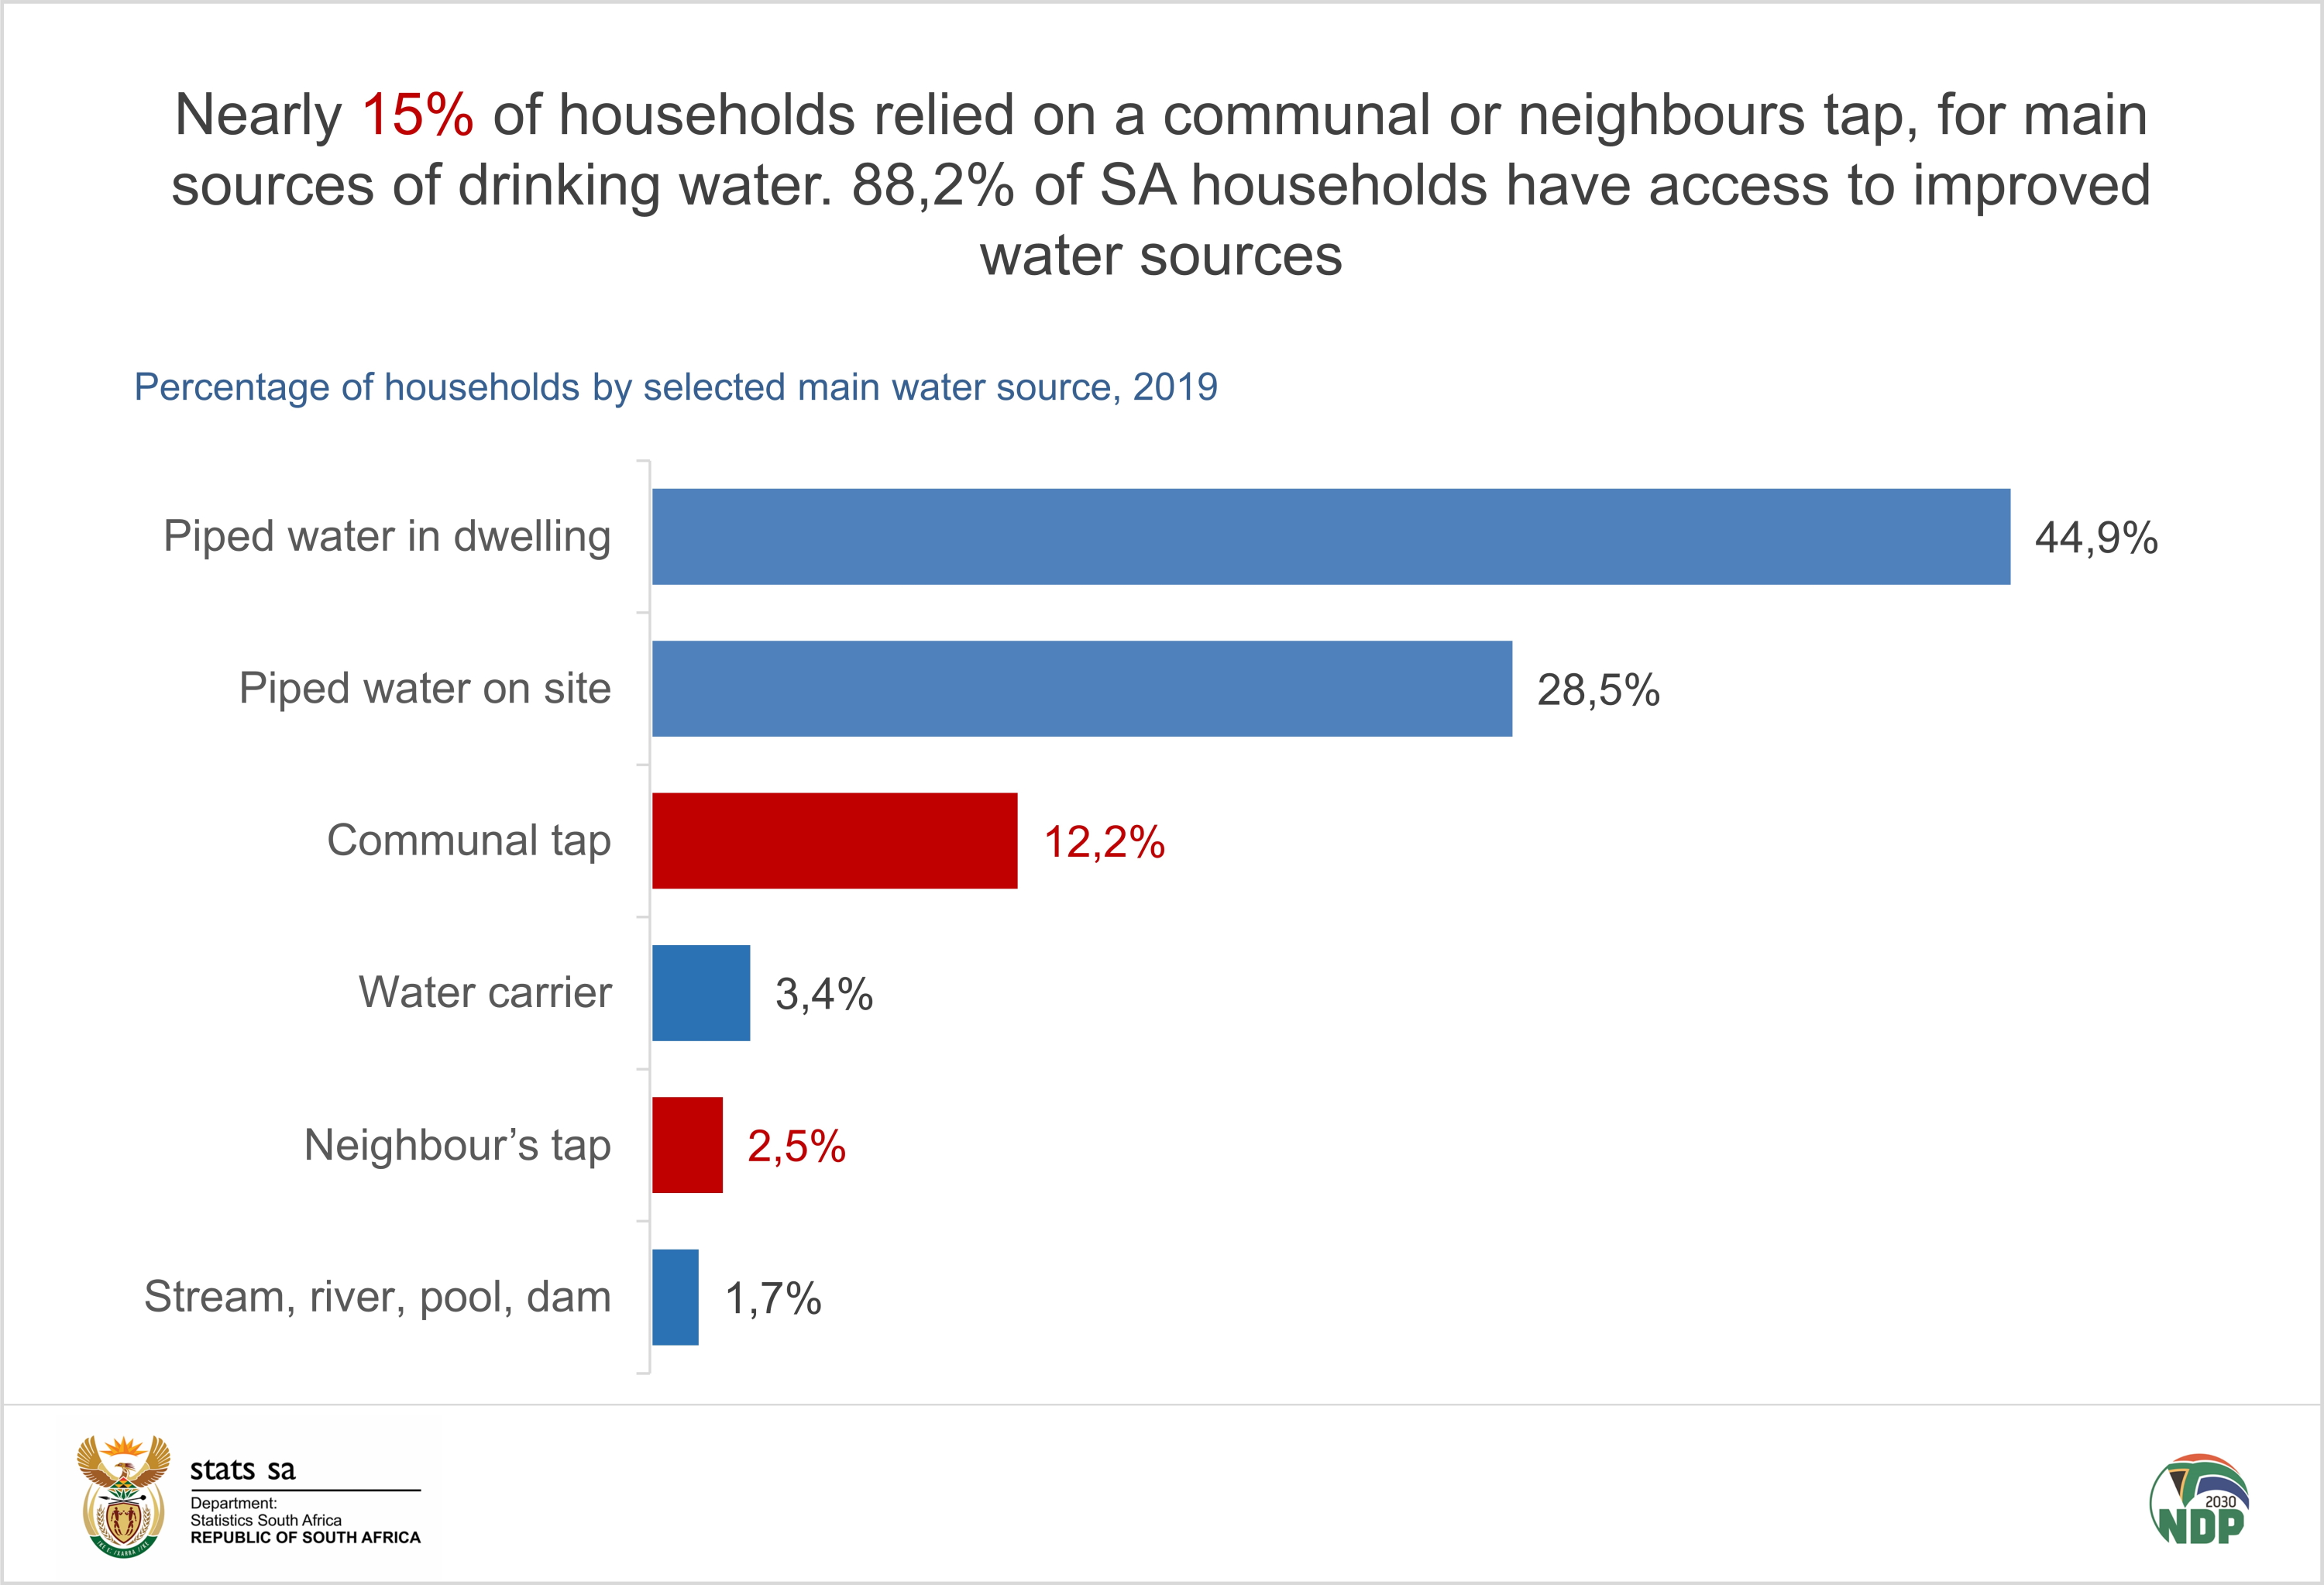
Access to an improved source of water
The percentage of households with access to an improved source of water increased by less than four percentage points between 2002 and 2018 (growing from 84,4% to 88,2%). The increases were much more notable in Eastern Cape (+17,8 percentage points) and KwaZulu-Natal (+10,0 percentage points).
Despite these notable improvements, access to water actually declined in five provinces between 2002 and 2019. The largest declined was observed in Mpumalanga (-5,3 percentage points), Limpopo (-3,8 percentage points) and Free State (-3,7 percentage points).
An estimated 44,9% of households had access to piped water in their dwellings in 2019. A further 28,5% accessed water on site while 12,2% relied on communal taps and 2,5% relied on neighbours’ taps. Although generally households’ access to water improved, 3,1% of households still had to fetch water from rivers, streams, stagnant water pools, dams, wells and
springs in 2019.
Access to an improved sanitation
Through the provision and the efforts of government, support agencies and existing stakeholders, the percentage of households with access to improved sanitation increased by 20,4 percentage points between 2002 and 2019, growing from 61,7% to 82,1%. Most improvement was noted in Eastern Cape where the percentage of households with access to improved sanitation increased by 54,1 percentage points to 87,6%, and Limpopo in which access increased by 36,5 percentage points to 63,4%. The installation of pit toilets with ventilation pipes played an important part in achieving the large improvements.
Access to electricity
An increase in the percentage of households that were connected to the electricity supply from the mains from 76,7% in 2002 to 85,0% in 2019, was accompanied by a decrease in the use of wood (20,0% to 7,8%) and paraffin (16,1% to 3,9%) over the same period. The common use of wood for cooking purposes in rural provinces such as Limpopo (32,1%) and Mpumalanga (16,7%) is, however, an indication that available resources are still very accessible and, most likely, less expensive than using electricity. One quarter (24,9%) of households did not use electricity for cooking in 2019, preferring to use gas (4,2%), paraffin (3,9%) and ‘Other sources’ such as solar electricity.
Household’s source of income
Social grants remain a vital safety net, particularly in the poorest provinces. The percentage of households and persons who benefitted from a social grant have increased notably since 2003. While 30,9% of persons benefitted from a grant in 2019, 45,5% of household received one or more grants. Grants were the second most important source of income (46,2%) for households after salaries (62,2%), and the main source of income for about one-fifth (20,4%) of households nationally. A larger percentage of households received grants compared to salaries as a source of income in Eastern Cape (61,1% versus 49,7%) and Limpopo (59,0% versus 49,6%). Grants were particularly important as a main source of income for households in Eastern Cape (37,5%), Limpopo (30,8%) and Northern Cape (28,6%).
For more information on the wide variety of fields covered, download the full report here.