
The shifting nature of South Africa’s landscape: a 24-year snapshot of land cover change
The land under our feet is, in several senses, living. Alive in terms of the organisms that support healthy soils to cultivate crops. Active in terms of abiotic (non-living) and biotic (living) factors that interact with each other to create distinct ecological systems. Malleable in terms of the changes that humans bring about.
Digital snapshots of 122 million pixels of land that make up mainland South Africa – each measuring 100 m2 – show how our landscape and terrestrial ecosystems have changed over a quarter of a century.
The discussion document Land and terrestrial ecosystem accounts, 1990 to 2014 was recently published by Stats SA in collaboration with the South African National Biodiversity Institute (SANBI) and the Department of Environment, Forestry and Fisheries (DEFF), as part of the EU-funded Natural Capital Accounting and Valuation of Ecosystem Services (NCAVES) project, led globally by the United Nations Statistics Division (UNSD) and UN Environment (UNEP). The document provides the first systematic national-level view of how South African land cover classes have shifted over time, over space and across themes – and of how this interplays with the country’s terrestrial ecosystems.1
Give and take: Change from 1990 to 2014
If you think about land cover change, you might assume that the urban footprint has expanded with South Africa’s growing population, which increased from 40,6 million people in 1996 to 55,7 million in 2016.2 To feed a growing population, you might also assume that cultivated land has expanded, replacing natural land.
However, the data reveal a more complex picture.
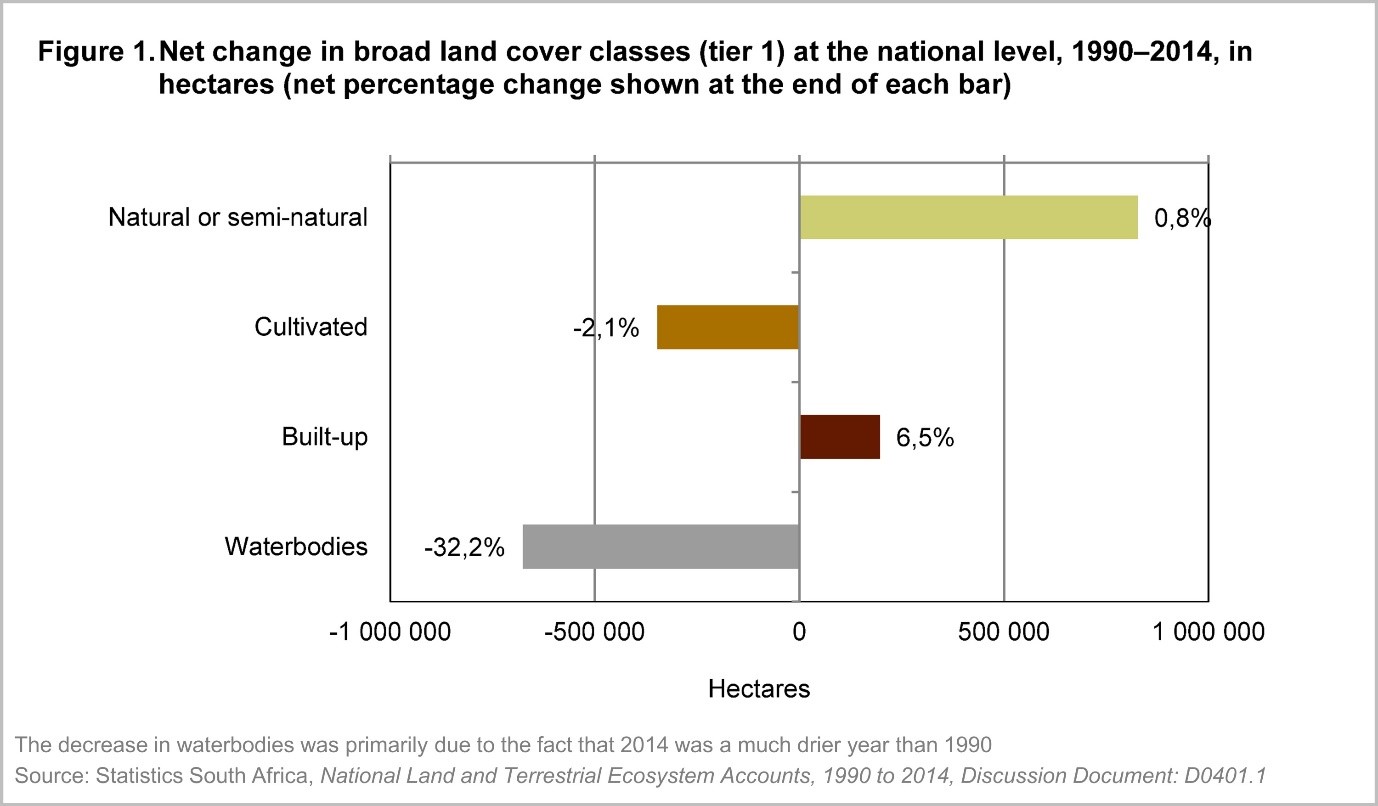
The total area of built-up land (which includes urban and mining land) has indeed increased, but perhaps surprisingly the total area of cultivated land (which includes crops, orchards, vines and plantations) has decreased (see Figure 1). The accounts show net change in the area covered by these intensively modified ecosystems.
Digging deeper: different ways of looking at change
Clearly, the interplay between the different types of land cover is a lot more complex – and far more interesting – than what we might expect.
What is significant about this particular discussion document is the way in which the data on land and terrestrial ecosystems have been compiled. A first for South Africa, the document expresses the data in the form of accounting tables, similar to what you would see in a typical balance sheet.
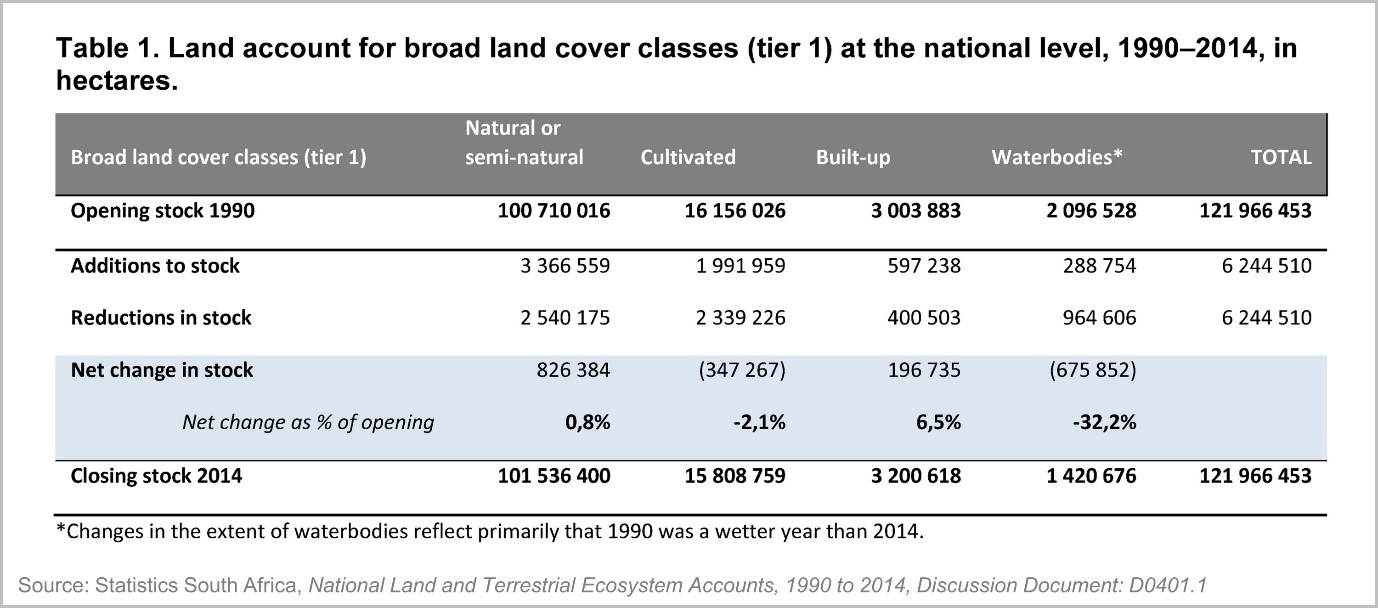
Each table has an opening balance or stock, in this case the stock of hectares covered by a particular land cover class in 1990. It also includes a closing stock taken in 2014. The difference between these two numbers tells us if land cover classes have grown or declined over time. This provides us with an indicator of net change (in hectares or as a percentage) for each land cover class.
Table 1 shows how 2,3 million hectares (ha) of cultivated land converted to other land classes over the 24-year period (reductions in stock). About 2,0 million ha of new cultivated land were developed over the same period (additions to stock), resulting in a net decrease of nearly 350 000 ha, or a decline of 2,1%.
The accounts provide another two indicators of change. These don’t appear in the table above, but are included in the document. First, turnover of land cover, which tells us something different from net change. A small net change can disguise substantial turnover or switching between different land cover classes, which could indicate socio-economic changes in the landscape. Second, the proportion of land in a given class that has remained unchanged, which gives an indication of how stable that land cover class has been over time.
The accounting methodology can also be used to create a second type of table, called a change matrix. This provides insight into which land cover classes changed to which.
In the change matrix below (Table 2), the majority of cultivated land (over 13,8 million ha) remained cultivated if we compare 2014 with 1990. However, farming operations have come and gone over the 24-year period of these accounts. Some areas have been allowed to lie fallow and return to what the satellite imagery picks up as natural or semi-natural in structure. Just over 2 million ha that were classified as cultivated in 1990 shifted to natural or semi-natural in 2014.
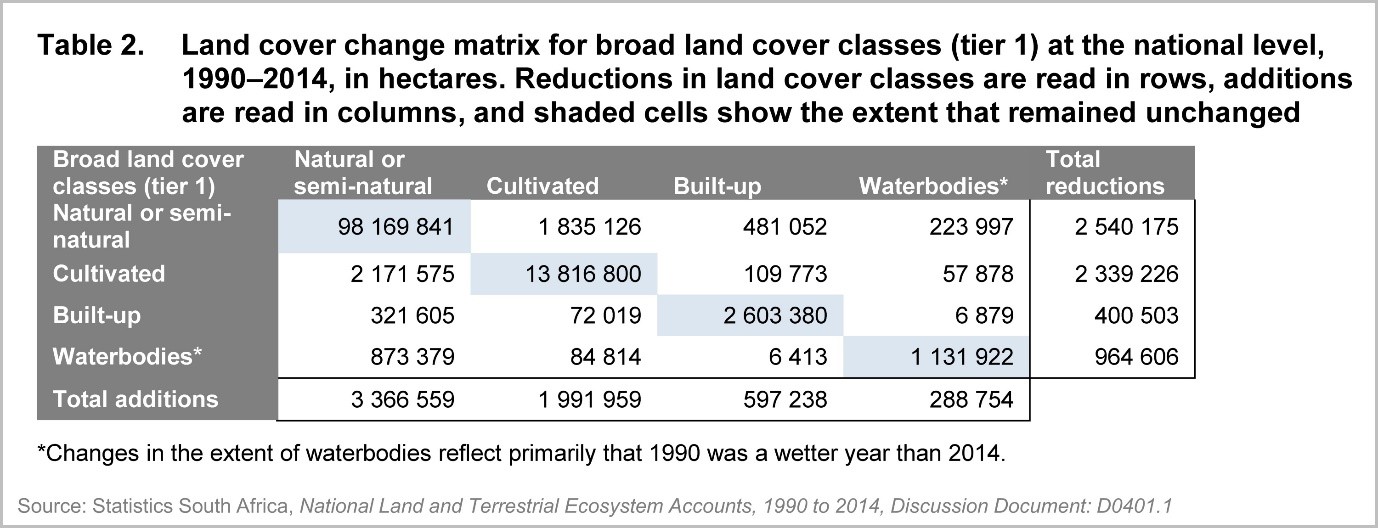
However, the extent of natural or semi-natural land cover should not be confused with its condition. Areas that appear natural or semi-natural might be in a poor ecological state – for example, because they have been over-grazed or invaded by alien trees. Such changes in condition are not detected by land accounts. Conversion of land from natural to cultivated results in loss of biodiversity and, depending on subsequent land management, loss of certain services that ecosystems provide to people. When cultivated land reverts to a semi-natural state, the biodiversity associated with those areas generally doesn’t recover, although some ecosystem services might.
Some areas that were natural or semi-natural changed to cultivated (just over 1,8 million ha).
Digging deeper still: Unpacking change in cultivated land
The broad land class categories listed in the tables above can be broken down further, and the same accounting methods can be applied.
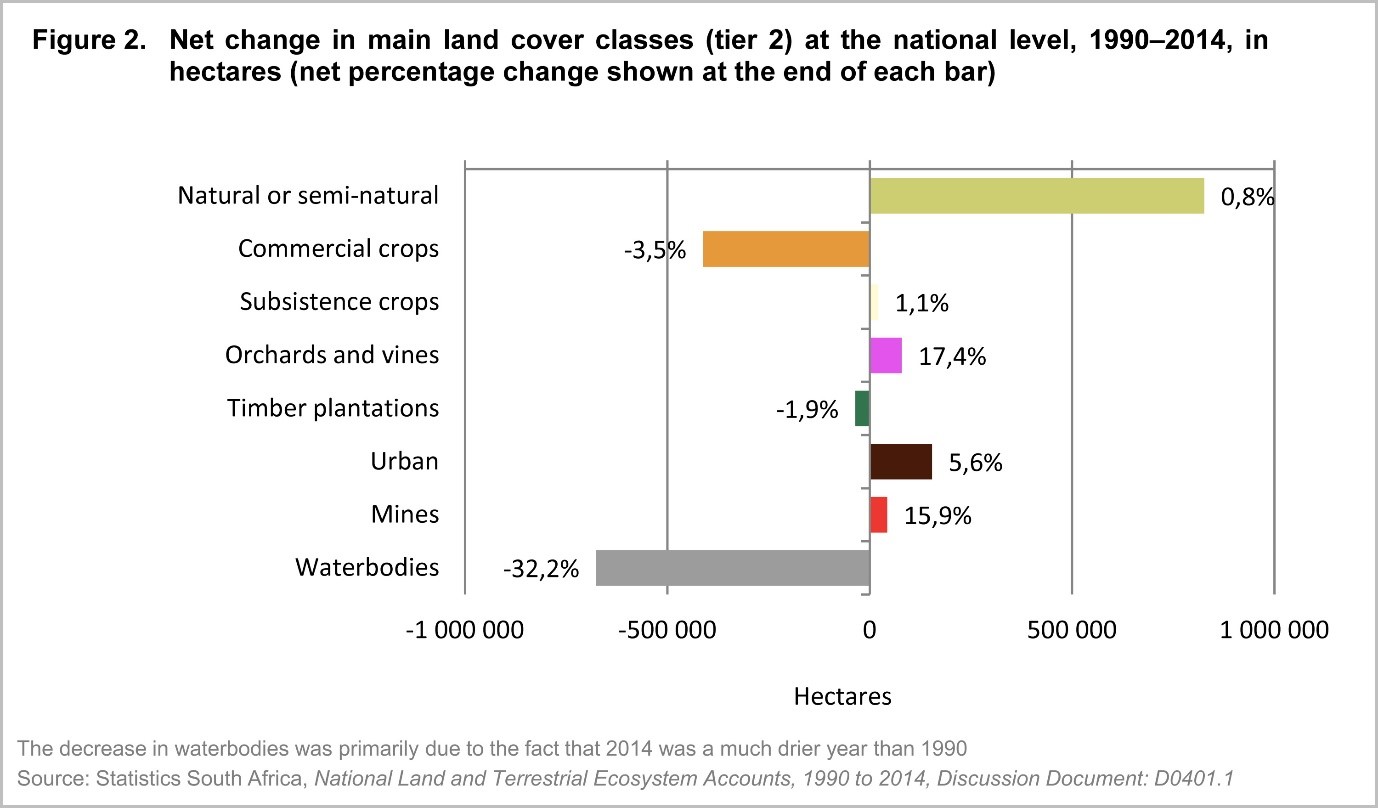
Peeling layers of data away like an onion, we can break cultivated land down into finer categories, shown in Figure 2. The land cover class “cultivation” includes commercial crops, subsistence crops, orchards and vines, and timber plantations. The overall decrease in cultivated land between 1990 and 2014 was mainly the result of decreases in commercial crops and timber plantations. The area of orchards and vines increased.
More detail emerges if we dig even deeper. We can break commercial crops down into cultivated fields, pivot-irrigation and sugarcane fields, as shown in Figure 3. “Cultivated fields” includes a wide range of crops, such as maize, wheat and sunflower seeds. The decline in cultivated commercial fields was the main reason for the decrease in the cultivated land cover class, with some commercial farms being converted to other land uses or falling fallow.
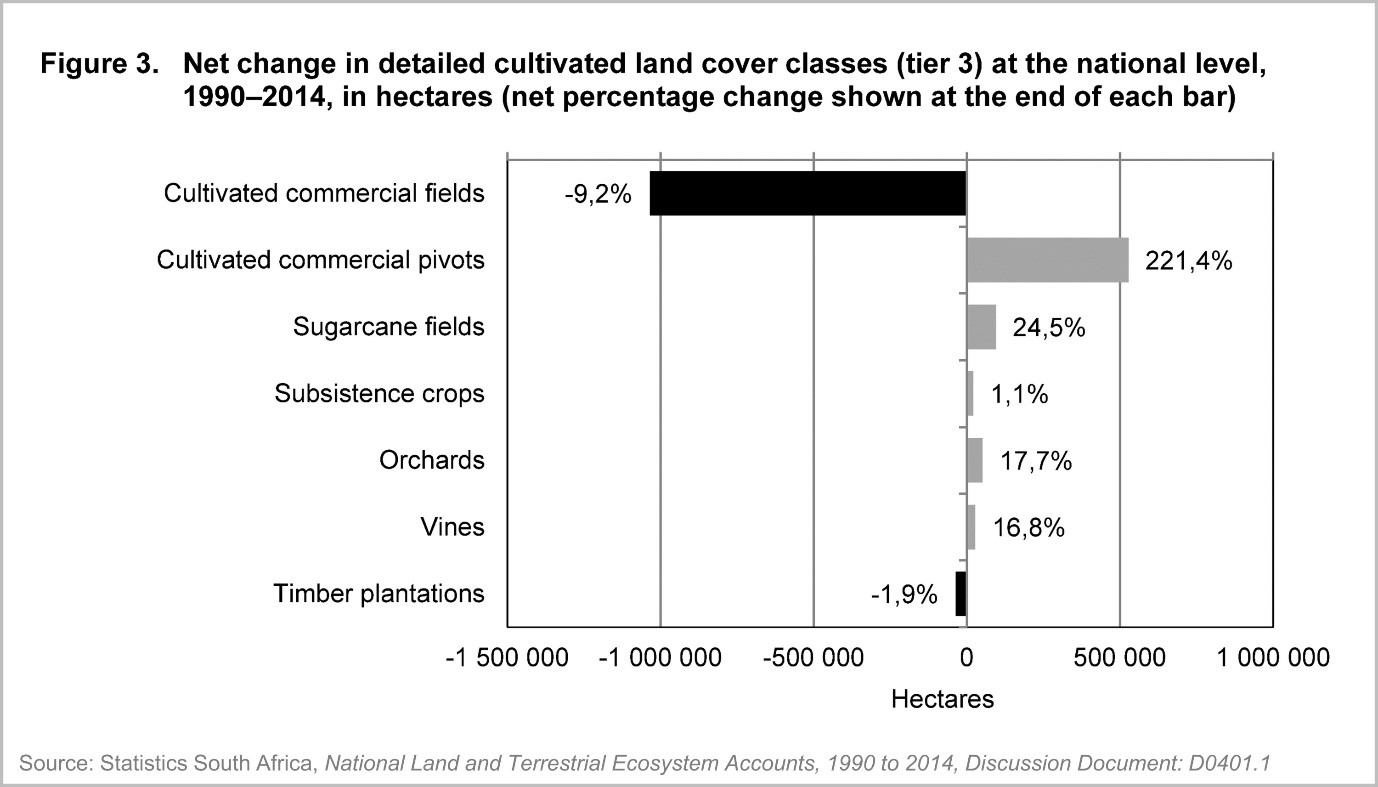
On the other hand, centre-pivot irrigated cultivation increased by 221,4%, from 238 686 ha to 767 096 ha between 1990 and 2014. Pivot-irrigated agriculture produces more tonnage per hectare than traditional forms of cultivation but requires more intensive infrastructural investments, nutrient applications and significantly greater water use.
Subsistence agriculture provides an interesting example of the importance of the turnover indicator. While the overall increase in subsistence crops was 1,1%, from 1,95 million ha in 1990 to 1,97 million ha in 2014, the turnover in subsistence crops was 46,4%. This indicates that there was switching of land in and out of subsistence crops, and could mean that there were substantial changes where cropping took place. Further investigation is needed to interpret these shifts.
Across space: provinces and municipalities
It gets even better. All the results shown so far provide a national breakdown. We can wring the data further and see how things have changed in each province and each district municipality. Potentially, the data can one day be used to drill down even further to local municipalities and towns.
The proportion of natural and semi-natural land is much lower in some parts of the country than others. The province of Gauteng, South Africa’s largest economic hub, has 52,5% of its natural or semi-natural cover remaining. In contrast, the extensive, largely arid Northern Cape has 98,6% of its natural or semi-natural cover remaining.
Let’s explore built-up land cover classes in more detail.
Built-up land as a broad land cover class increased by 6,5% from 1990 to 2014. On a district level, built-up land increased in two thirds of South Africa’s 52 district and metropolitan municipalities. Nkangala District (DC31) in Mpumalanga and Sekhukhune District (DC47) in Limpopo recorded the greatest percentage increases, at 45,0% and 34,0% respectively (Figure 4).
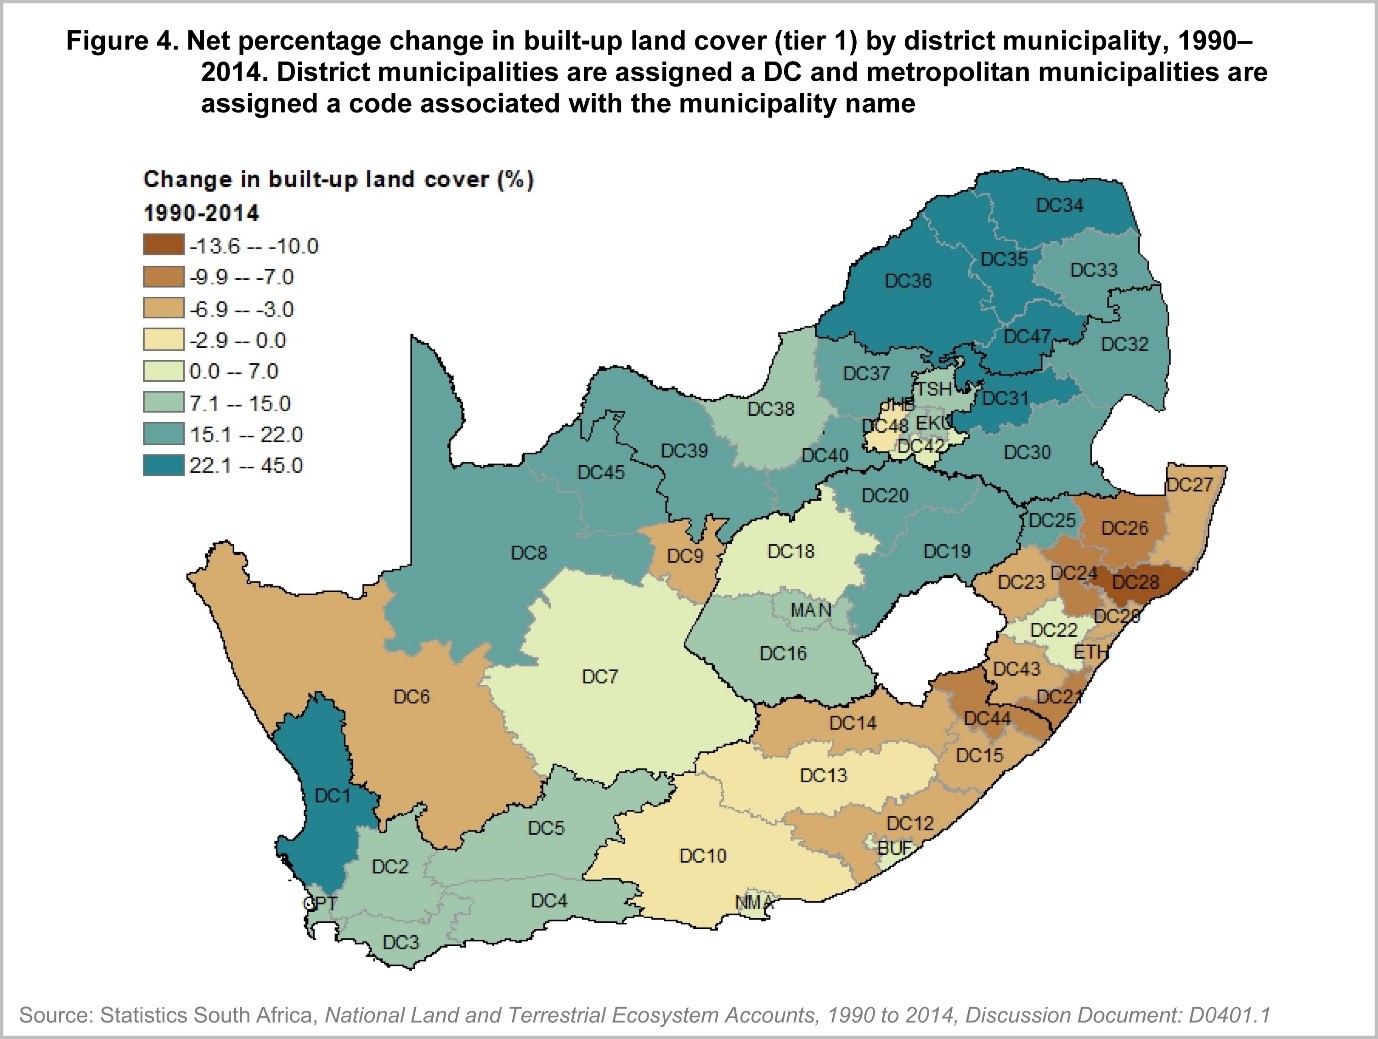
In fact, Limpopo and Mpumalanga contain the majority of district municipalities where the expansion in built-up land occurred. Mining is the biggest industry in these two provinces. The role of mining in these increases in built-up areas can be further analysed using the land accounts.
Adopting the accounting approach for better decision making
One of the major benefits of using an accounting approach, as outlined above, is that these data are comparable to data from the System of National Accounts, from which the gross domestic product (GDP) as well as other economic statistics are drawn. The intention behind this is that decision-makers are better able to make comparisons and see synergies and trade-offs between social, economic and environmental goals and priorities.
In this way, natural capital accounts – such as these land accounts and future accounts to be published by Stats SA – are contributing to the richness of evidence available to decision-makers for strategic planning at the national level as well as those involved in land-use planning, environmental management, water resource management, financial management, and conservation at the provincial, catchment or municipal level.
1 Download the Land and terrestrial ecosystem accounts, 1990 to 2014 document here. This is the first discussion document in Stats SA’s Natural Capital Series. Watch this space for further releases in this series!
2 Stats SA, Community Survey 2016 in Brief, Table 2, page 16 (download here).
Similar articles are available on the Stats SA website and can be accessed here.
For a monthly overview of economic indicators and infographics, catch the latest edition of the Stats Biz newsletter here.