
Steep slump in GDP as COVID-19 takes its toll on the economy
The punch in the gut was severe. Perhaps the second quarter of 2020 will become known as the pandemic quarter. South Africa’s economy suffered a significant contraction during April, May and June, when the country operated under widespread lockdown restrictions in response to COVID-19.
Gross domestic product (GDP) fell by just over 16% between the first and second quarters of 2020, giving an annualised growth rate of ‑51%.1
This contraction dwarfs the annualised slowdown of 6,1% recorded in the first quarter of 2009 during the global financial crisis. Historical data from 1960, sourced from the South African Reserve Bank, show that the second quarter of 2020 experienced the biggest fall in GDP since that year, far steeper than the annualised 8,2% decline in the fourth quarter of 1982.2
In constant 2010 prices, the country generated almost R654 billion (not annualised) in the second quarter of 2020. This was the lowest level of production since the first quarter of 2009 when the economy generated R649 billion.
Agriculture keeps its head above water as economy dives
Nearly all industries experienced a massive drop in output in the second quarter of 2020. Construction was the biggest loser. Already in bad shape before the pandemic, the industry experienced its eighth consecutive quarter of economic decline, slumping further by 76,6% (note that this and following growth rates are all annualised).
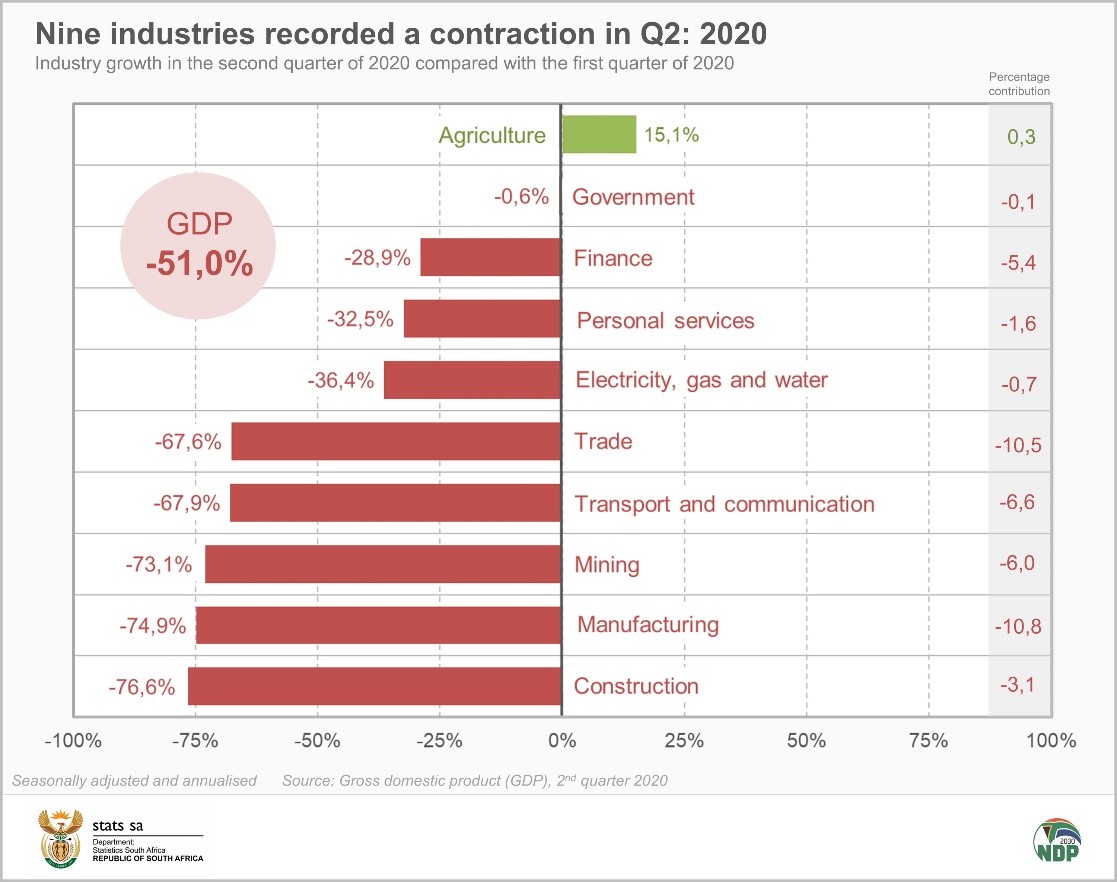
Manufacturing output shrank by 74,9%. Plagued by work stoppages and lower demand for steel, factories specialising in metals and machinery were severely affected. The ban on alcohol sales had a heavy impact on the food and beverage division of manufacturing.
Air travel came to an almost complete halt, contributing to the fall in economic activity in the transport and communication industry. There was also less activity by rail and road freight operators due to restrictions on the production and movement of various goods.
The retail ban on alcohol sales and closure of tourist accommodation facilities were notable drags on trade activity. Wholesalers and motor vehicle traders also reported significant declines.
Finance and personal services, the two industries that have shown a great deal of resilience over the last decade, did not escape the maelstrom. The finance industry, which includes banking, insurance services, real estate and business services, fell by 28,9%.
Personal services recorded its first quarter of negative growth since 2009. Businesses, such as gyms and hairdressers, closed their doors and hospitals halted elective operations. The cancelation of sporting and recreation events also dragged the industry lower.
Agriculture was the only industry that seemed relatively unaffected. An increase in maize exports, as well as rising international demand for citrus fruits and pecan nuts, helped the industry expand by 15,1%. Locally, the baking craze that gripped the country during the lockdown increased the demand for home cooking products.
Household spending plummets, but consumers spend more on communication
Stats SA also measures the expenditure side of GDP, reflecting the demand side of the economy. Expenditure on GDP in the second quarter tumbled by 52,3% (seasonally adjusted and annualised), dragged lower mainly by falling exports and household spending.
Household spending slumped by 49,8% in line with the closure of hotels, restaurants, transport services, recreational facilities and many stores. Spending on restaurants and hotels ground to an almost complete halt, plunging by 99,9%.

The alcohol and cigarette bans had an impact too. Consumer spending on these items fell by 92,4%.
Communication, housing and education expenditure was up in the second quarter. Cut off from family and friends – and having to suddenly work and study from home – many consumers increased their spending on communication services (most notably on data).
For more information, download the GDP release, media presentation and the associated Excel files here.
1 An annualised growth rate shows what growth would be over a full year if the quarter-on-quarter growth rate were to occur four times in succession. Unless otherwise indicated, all growth rates in this article are quarter-on-quarter, seasonally adjusted and annualised, and in real (volume) terms.
2 South African Reserve Bank, Historical macroeconomic timeseries information, Gross domestic product at market prices (KBP6006D) (access the data here). An annualised quarter-on-quarter growth rate was applied to the data for this article.
Similar articles are available on the Stats SA website and can be accessed here.
For a monthly overview of economic indicators and infographics, catch the latest edition of the Stats Biz newsletter here.