Economy dodges recession as GDP climbs 3,1%
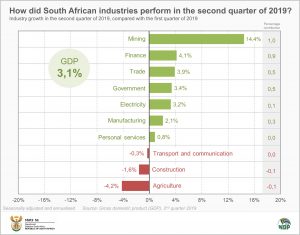
After shrinking sharply in the first quarter of 2019, the economy rebounded from a low base to record positive growth of 3,1%1 in the second quarter (April−June). Mining, finance, trade and government services were the main drivers of growth. Three industries (construction, agriculture and transport) registered a slump in production.
Mining was the strongest performer in the second quarter, expanding by 14,4%. This was the industry’s strongest showing in three years since the second quarter of 2016 when production jumped by 16,3%.
Iron ore, manganese and coal were the main contributors to mining growth. Iron ore production climbed by 11,8% (not annualised) in the second quarter of 2019. Manganese was up by 21,2% (not annualised) and coal by 3,6% (not annualised), according to the Mining: Production and sales release. Gold failed to impress, however, shrinking by 4,1% (not annualised).2
Finance, real estate and business services – the largest industry in the South African economy – grew by 4,1%. This was on the back of stronger performances by the banking and insurance sectors.
Buoyant wholesale, retail and motor trade sales in the South African economy lifted the trade industry by 3,9%.
Government saw its biggest increase since the second quarter of 2014. A rise in contract employment in the public sector, particularly during May’s general elections, underpinned the growth in government activity.
Electricity, gas and water (spurred on by a rise in electricity distributed), manufacturing (driven by higher output in food, transport, and metals & machinery) and personal services were the other three industries that saw positive growth in the second quarter.
Not all industries did well, however. Transport and communication edged lower. Agriculture fell by 4,2% on the back of lower production of field crops and horticultural products.
The construction industry remained firmly in recession, contracting for the fourth quarter in a row. A drop off in activity related to non-residential buildings and construction works constrained growth in the second quarter.
Stats SA also measures the expenditure side of GDP, providing an indication of total spending in the economy. It includes government spending, household spending, investment spending (gross fixed capital formation and changes in inventories), and net exports. Expenditure on GDP in the second quarter increased by 3,0% quarter-on-quarter (seasonally adjusted and annualised), spurred on by a build-up of inventories and increased household expenditure, government spending and investment.
Household consumption expenditure increased by 2,8% in the second quarter, mainly driven by a rise in spending on food and non-alcoholic beverages, as well as recreation and culture. Households held back on eating out and accommodation, however. Spending on restaurants and hotels slipped by 3,8%.
Gross fixed capital formation (fixed investment) increased by 6,1% in the second quarter, driven mostly by increased spending on machinery and transport equipment. This is the first positive rise in gross fixed capital formation since the fourth quarter of 2017. However, activities related to construction works and non-residential buildings were down in the second quarter of 2019.
South African exports of goods and services edged lower (-0,7%), largely influenced by a fall in the trade of pearls, precious and semi-precious stones. In contrast, imports jumped by 18,8% in the second quarter, driven mostly by a rise in trade of machinery and electrical equipment, mineral products and chemical products.
Key facts from the GDP release for the second quarter of 2019:
- Real GDP in the second quarter was up 3,1% quarter-on-quarter (seasonally adjusted and annualised).
- Unadjusted real GDP in the second quarter was up 0,9% year-on-year.
- Unadjusted nominal GDP in the second quarter of 2019 was estimated at R1,26 trillion, higher than the R1,20 trillion recorded in the first quarter of 2019.
For more information, download the latest GDP report and media presentation here.
1 Unless otherwise indicated, all growth rates are quarter-on-quarter, seasonally adjusted and annualised, and in real (volume) terms.
2 Stats SA, Mining: Production and sales, June 2019. Table B (download here).
Similar articles are available on the Stats SA website and can be accessed here.
For a monthly overview of economic indicators and infographics, catch the latest edition of the Stats Biz newsletter here.


