Four facts about our provincial economies
Each province is unique. Data published recently by Stats SA provide a portrait of South Africa’s provincial economies. Here are four facts you might not have known about our economic landscape.
Fact #1 Gauteng is South Africa’s economic powerhouse
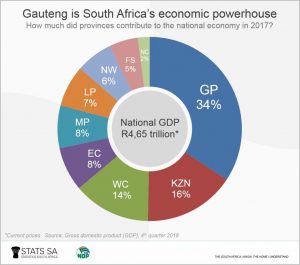
Don’t let Gauteng’s size on a map fool you. It might be the province with the smallest land area, but economically it packs a punch. Gauteng generated just over a third of South Africa’s gross domestic product (GDP) in 2017, making it the nation’s biggest provincial economy (click on the chart to enlarge).
KwaZulu-Natal was the second biggest, responsible for R16 of every R100 generated by the national economy. Northern Cape, the smallest provincial player, would need to multiply its economic output by 17 in order to square up against Gauteng.
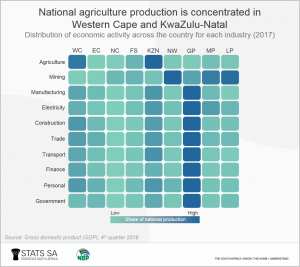
Gauteng’s economic dominance is not surprising. Finance, government, manufacturing, construction and four other industries are heavily represented in the province.
Agriculture and mining are the two exceptions. National agriculture production is mostly concentrated in Western Cape and KwaZulu-Natal. The bulk of national mining activity takes place in North West, Mpumalanga and Limpopo.
Fact #2 Gauteng’s GDP per capita is double that of Eastern Cape
Not only is Gauteng the province with the largest GDP, but it is also the most populous. Gauteng was home to 14,3 million people in 2017, according to data from Stats SA’s Mid-year population estimates report.1
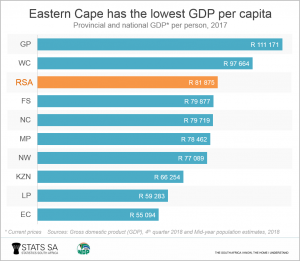
The province contributed R1,59 trillion to the country’s GDP of R4,65 trillion (current prices), translating to R111 171 per person. This makes it the top ranking province in terms of GDP per capita, followed by Western Cape and Free State
Eastern Cape, on the other hand, was the lowest ranking province. Even if Eastern Cape were able to double its GDP per capita, it would still be slightly lower than that of Gauteng.
National GDP per capita was estimated at R81 875 in 2017.
Fact #3: Government is the biggest industry in Eastern Cape and Free State
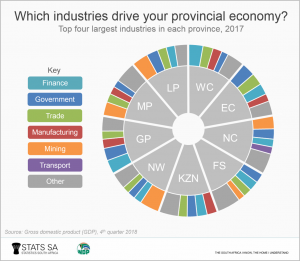
GDP per capita can be boosted if dominant industries in each province grow at a rate that outstrips population growth. Each province has its own unique industrial makeup. Western Cape, for example, is dominated by the finance and business services, trade, and manufacturing industries.
Government is the largest industry in Eastern Cape and Free State, and second in Gauteng and Limpopo. This shows the importance of government as a driver of economic activity. In fact, nationally it is the second biggest industry after finance and business services, contributing 18% to South Africa’s GDP.2
Mining is the most important industry in Northern Cape, North West, Mpumalanga and Limpopo. Rich deposits of platinum, chromite, gold, uranium and other minerals underpin the industry’s dominance in North West. Mining contributed 34% to North West’s GDP in 2017.
Fact #4: Northern Cape’s economy led the charge in 2017
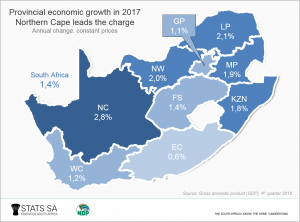
Mining was one of the contributors to Northern Cape’s strong growth in 2017. Northern Cape’s GDP expanded by 2,8%, the highest rate of all provinces. Agriculture was also a major contributor to the rise.
In fact, Free State, North West, Limpopo and Mpumalanga also saw growth higher than the national rate due to stronger performance in both agriculture and mining. Of all the provinces, Western Cape’s agriculture industry saw the slowest growth in 2017. This was mainly due to the sluggish recovery from drought.
Gauteng’s growth rate was close to the national rate as the province is the biggest contributor to the national GDP and has a significant representation of nearly all economic activity.
For more information, download the provincial GDP data from: Stats SA, Annual quarterly and regional Fourth quarter 2018 [Excel file], Tables 16 to 25 (available here).
1 Stats SA, Provincial projection by sex and age (2002-2018) [Excel file] (download here).
2 Gross domestic product (GDP), 4th quarter 2018, Media presentation (view here).


