

IMPROVING LIVES THROUGH DATA ECOSYSTEMS
Dismal December for retailers
The most important month of the year for retail trade is December, when many consumers are on holiday and go Christmas shopping. But December 2018 was a tough month for retail in South Africa. The volume of sales fell by 1,4% year-on-year, which was the first negative annual growth rate since February 2017.
The poor performance of retailers in December came after a much better November, when Black Friday boosted sales to 2,9% year-on-year (volume). The Black Friday effect has been growing in strength in recent years, resulting in a partial shift of sales from December to November.
Retail volumes
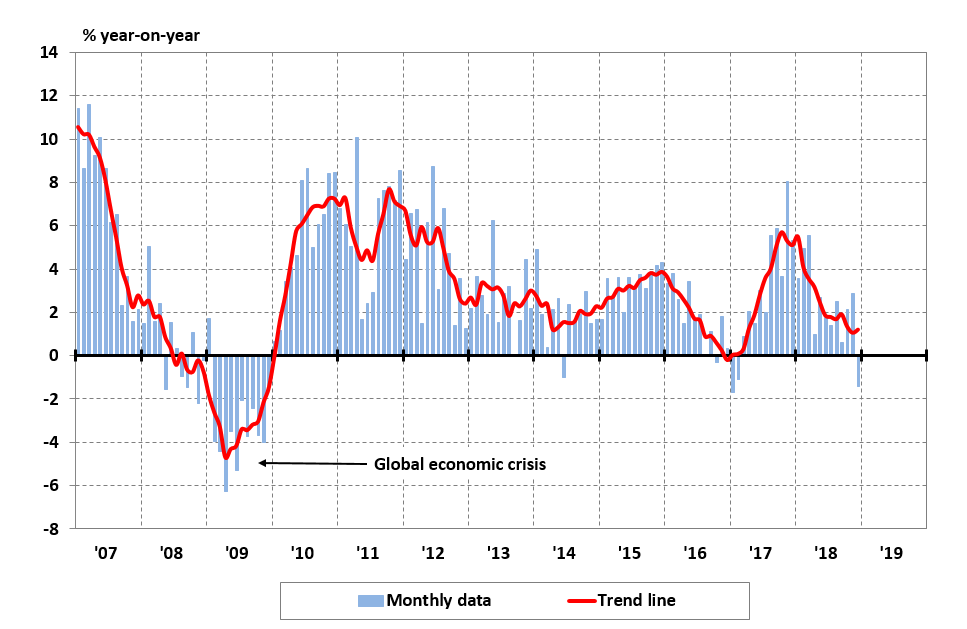
Looking at the whole of 2018, the volume of retail trade grew by 2,1% compared with 2017, down from annual growth of 3,1% in 2017 and up from 1,7% in 2016. In 2018 the annual growth rate got off to a good start of 4,7% in the first quarter, but it fell to just 1,8% in the second quarter and 1,5% in the third. In the fourth quarter it was 1%. The decline in the growth rate during 2018 is clearly visible in the trend line shown in Figure 1.
Figure 1 – Retail trade sales volume: year-on-year growth rate
Retail prices (inflation)
Figure 1 shows the performance of retail trade in volume terms, but also of interest to retailers is the price dimension of their sales, i.e. inflation. Annual retail inflation fell from an average of 6,2% in 2016 to 4,1% in 2017, and fell further to an average of just 2% in 2018, as measured by the retail components of the consumer price index. The items from the CPI used to estimate retail inflation are essentially those that constitute the CPI for goods, excluding vehicles, fuel and electricity, and retail weights are used instead of CPI weights. Total CPI inflation (all consumer goods and services) was 4,7% in 2018. The low rate of retail inflation in 2018 points to the tough trading environment faced by many retailers during the year. Measured at current prices, i.e. taking both volume and price changes into account, the annual growth rate of retail trade fell from 8,1% in 2016 to 7,2% in 2017 and 4,2% in 2018.
Survey information and performance by sector
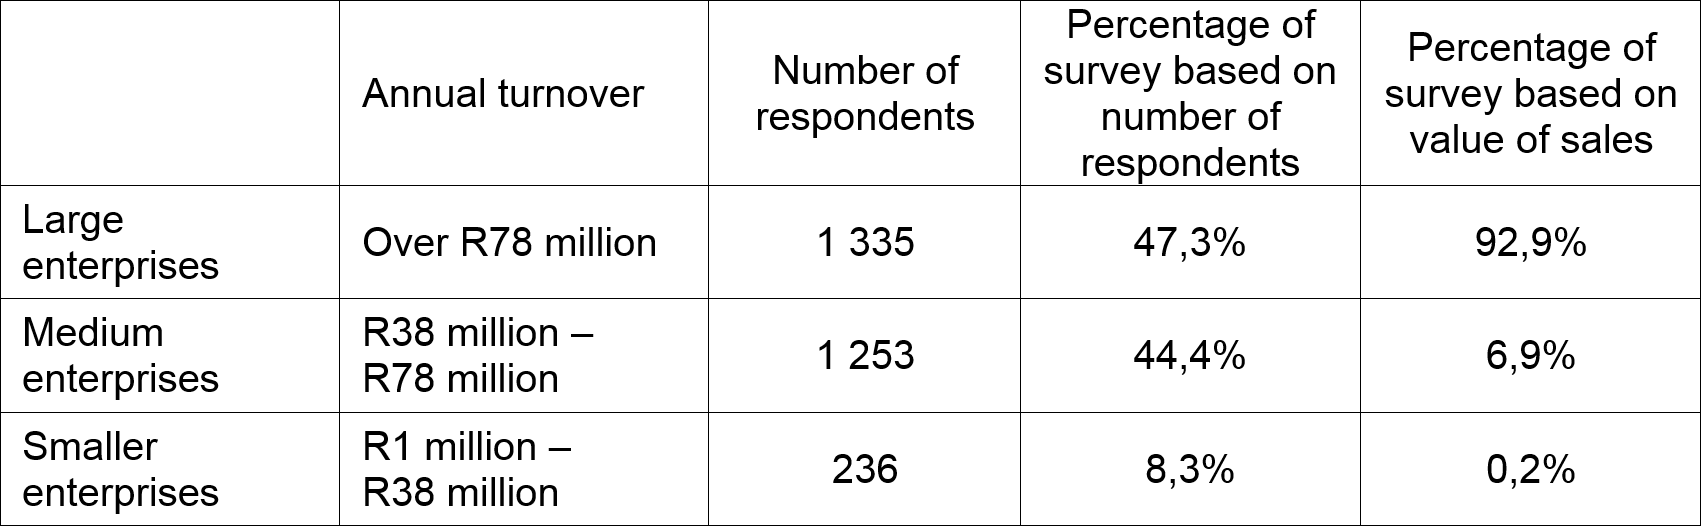
Stats SA’s monthly survey of retail trade is based on approximately 2 800 respondents. The respondents come in all shapes and sizes. All large and medium retailers are included in the survey, and estimates are made for smaller retailers using a sample which is updated annually. The survey is confined to income from sales only (i.e. other types of income such as interest, dividends and sales of assets are excluded), and it is also confined to sales in South Africa.
The structure of the survey is summarised in Table 1. The survey results are heavily dominated by the large enterprises, which account for 93% of the value of sales.
Table 1 – Structure of retail survey
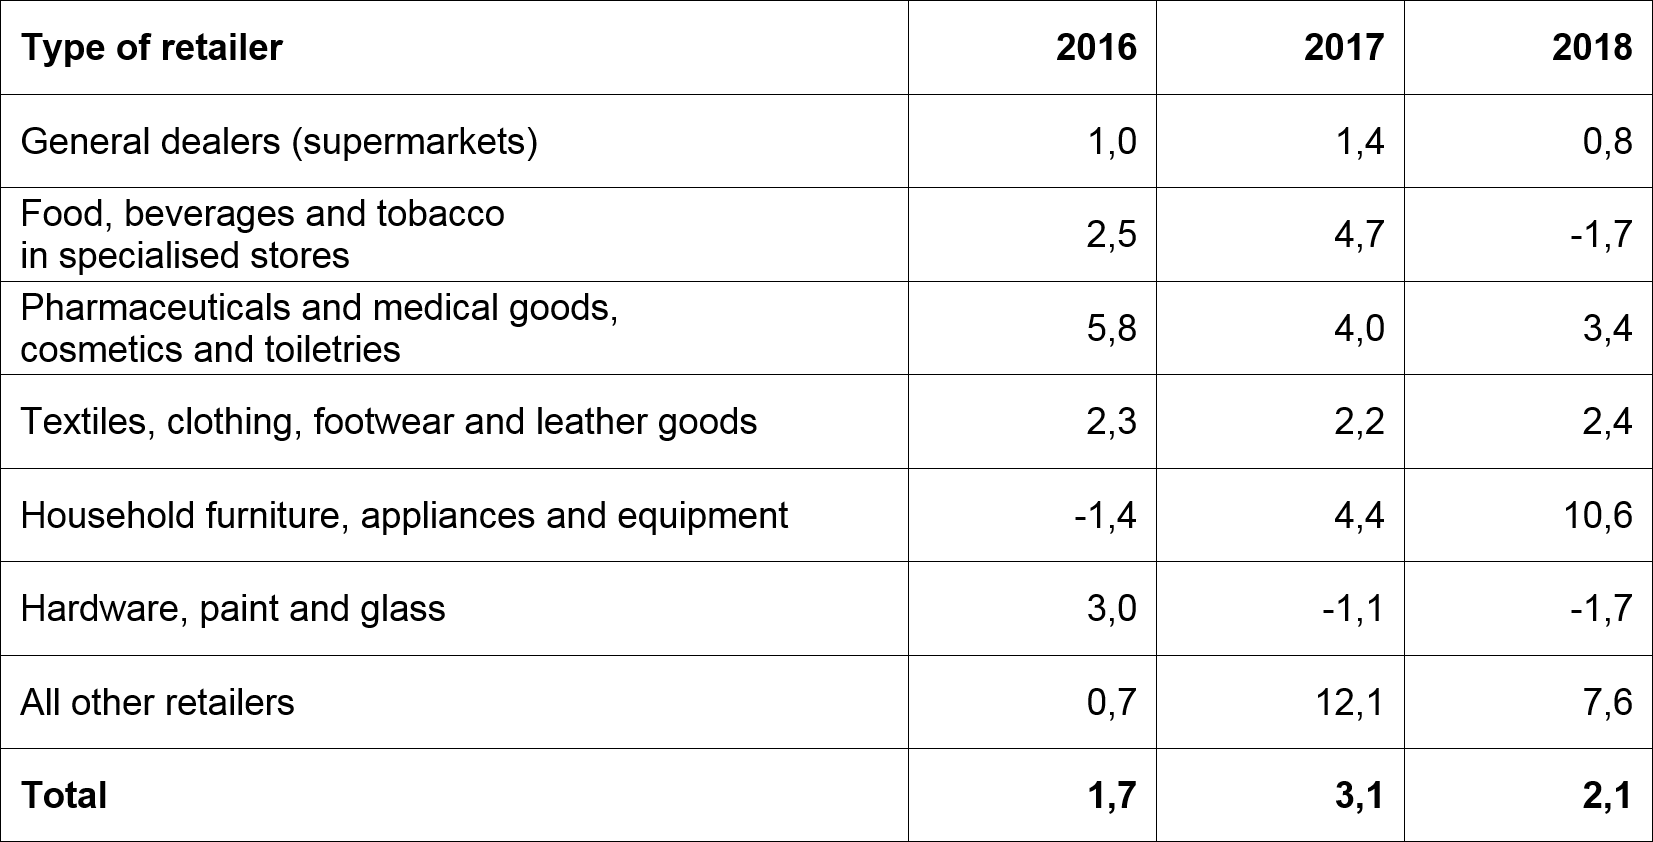
The respondents are classified according to their main type of retail trade, as listed in Table 2. They report the value of their sales at current prices, and Stats SA uses these to make estimates for each type of retailer and the total. To make estimates of volumes, Stats SA converts each type of trade to constant prices using the relevant components of the CPI.
In any given month, quarter or year, there is usually a wide variation of performance amongst the different types of retail. For instance, in 2018 annual volume growth ranged from -1,7% for both ‘food, beverages and tobacco in specialised stores’ and ‘hardware, paint and glass’ to 10,6% for ‘household furniture, appliances and equipment’.
Table 2 – Retail trade sales volume: annual growth rate (%) by type of retailer
To further demonstrate the high degree of variability of growth rates within retail trade, consider Figure 2. For example, in December 2018, 31% of respondents had annual growth in sales in the 0%–10% range measured at current prices, and 14% of respondents were in the 11%–20% range. Many respondents had negative growth (falling sales), e.g. 23% of respondents had growth between 0% and ‑10% in December 2018.
Figure 2 – Percentage of respondents in each growth rate range, current prices
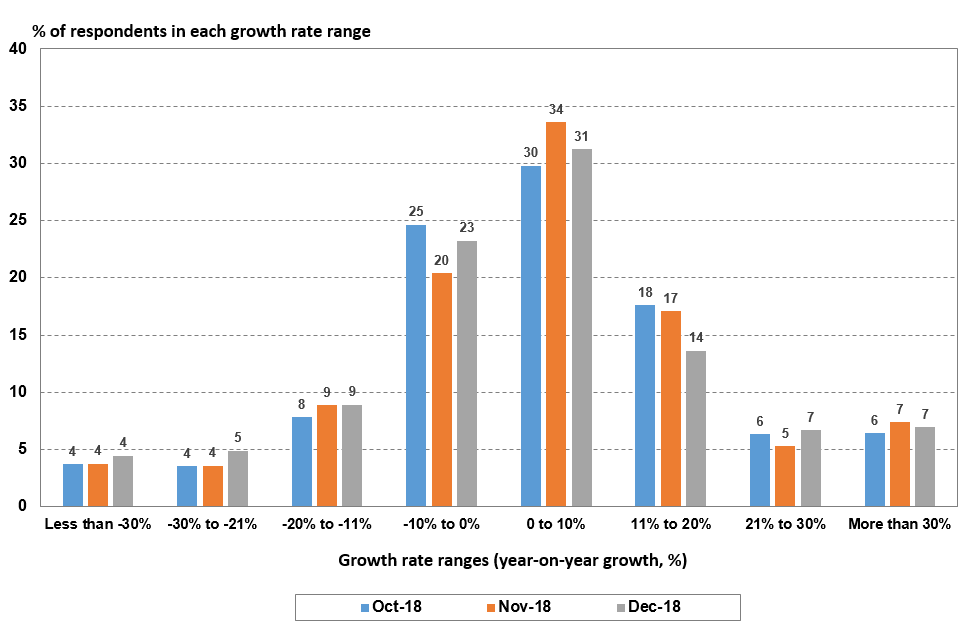
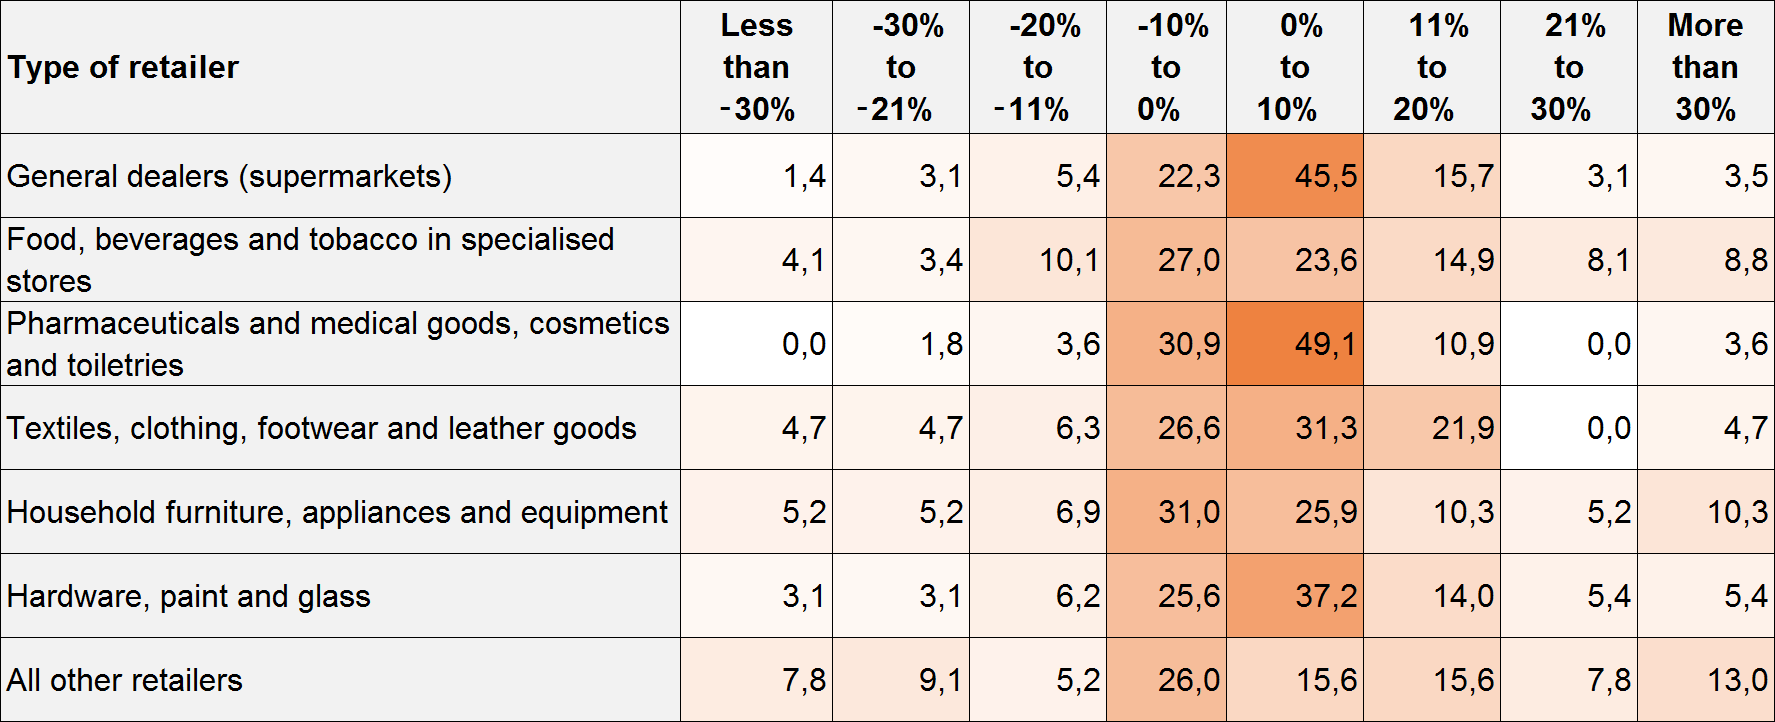
Table 3 provides similar information to Figure 2, except the results are shown by type of retailer for the three months October to December 2018 combined1. For example, Table 3 shows that in the fourth quarter of 2018, 45,5% of general retailers had year-on-year growth in the 0%–10% range, and 15,7% were in the 11%–20% range. An important point that emerges from Figure 2 and Tables 2 and 3 is that in any particular month or quarter or year, many retailers flourish while many others flounder.
Table 3 – Percentage of respondents in each growth rate range, at current prices, fourth quarter of 2018
Black Friday and seasonal adjustment
Finally, let’s return briefly to the Black Friday effect and seasonality. If retail sales were spread evenly over the 12 months, each month would account for 8,33% of annual sales. But as noted above, retail sales are highly seasonal, with December being the most active month. In 2012, December accounted for 11,8% of annual sales. This proportion dropped to 11,3% in 2018. Over the same period, November’s sales rose from 8,9% of annual sales to 9,5%, largely because of Black Friday promotions. For November and December combined, the proportion of sales was relatively steady between 2012 and 2018, averaging just under 21%. This shifting from December to November has made the seasonal adjustment of retail sales difficult, as seasonal adjustment relies on regular or repeated patterns over a long period, whereas the Black Friday effect does not have a long track record. The distortion that this causes to seasonal adjustment effects will subside over time.
Download the December 2018 Retail trade sales release here.
1 Figure 2 is based on enterprises that responded in the month shown as well as the corresponding month in 2017. Similarly, Table 3 is based on enterprises that responded throughout the fourth quarter of both 2018 and 2017.
Similar articles are available on the Stats SA website and can be accessed here.
For a monthly overview of economic indicators and infographics, catch the latest edition of the Stats Biz newsletter here.