
If South Africa’s provinces were independent states
Perspective matters. A lot. Recent provincial economic data published by Stats SA take on a fresh light when they’re ranked against other countries.
Gauteng is South Africa’s economic powerhouse. The province contributed just over a third to South Africa’s economic output in 2016, according to provincial gross domestic product (GDP) figures.1 In runner-up positions were KwaZulu-Natal and Western Cape, the second and third largest economies. Northern Cape, the least populous province, contributed just 2% to national GDP, making it the smallest provincial economy.
How do the provinces square up against other countries?
In 2016, Gauteng’s economy was roughly the same size as that of North Africa’s Morocco, if we use nominal GDP figures as a comparison.2 KwaZulu-Natal produced a level of economic output that was similar to that of Tanzania. Northern Cape has an economy that was roughly on par with that of Bermuda.
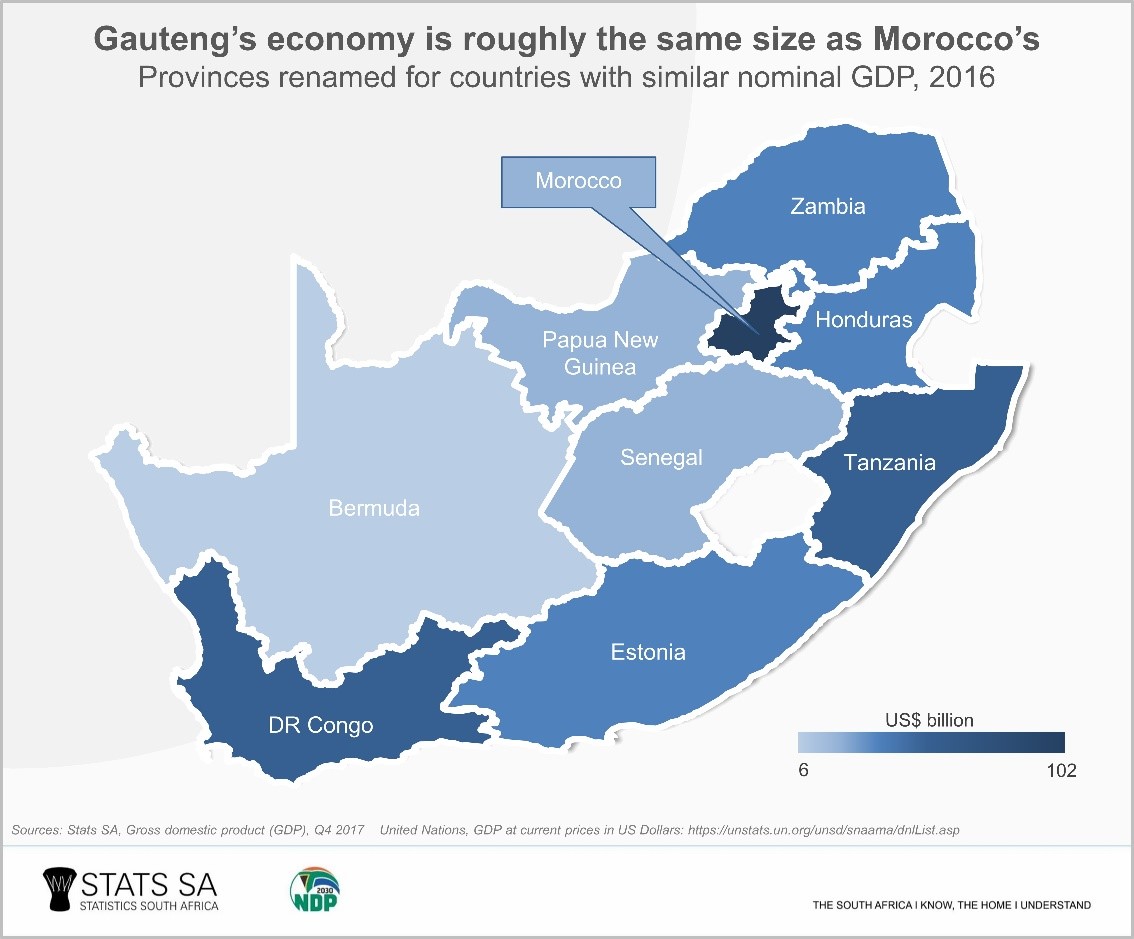
Roughly is the key word here. There are different ways to compare economic activity across nations, and many factors to keep in mind when doing so. Figures can differ according to the method used to produce estimates, and nominal GDP figures in US dollars (used here) can change significantly over time due to shifting exchange rates.
How do the provinces measure up on the African continent?
If Gauteng suddenly decided to split off and become its own nation, it would find itself in the top 10. In 2016, its economy was the seventh largest in Africa, surpassing heavyweights such as Kenya and Tanzania. KwaZulu-Natal was ranked in twelfth place, larger than the economies of Ghana and Tunisia.
Western Cape was in sixteenth spot, generating about the same level of economic activity as the Democratic Republic of the Congo (DRC) (click on the chart to enlarge).
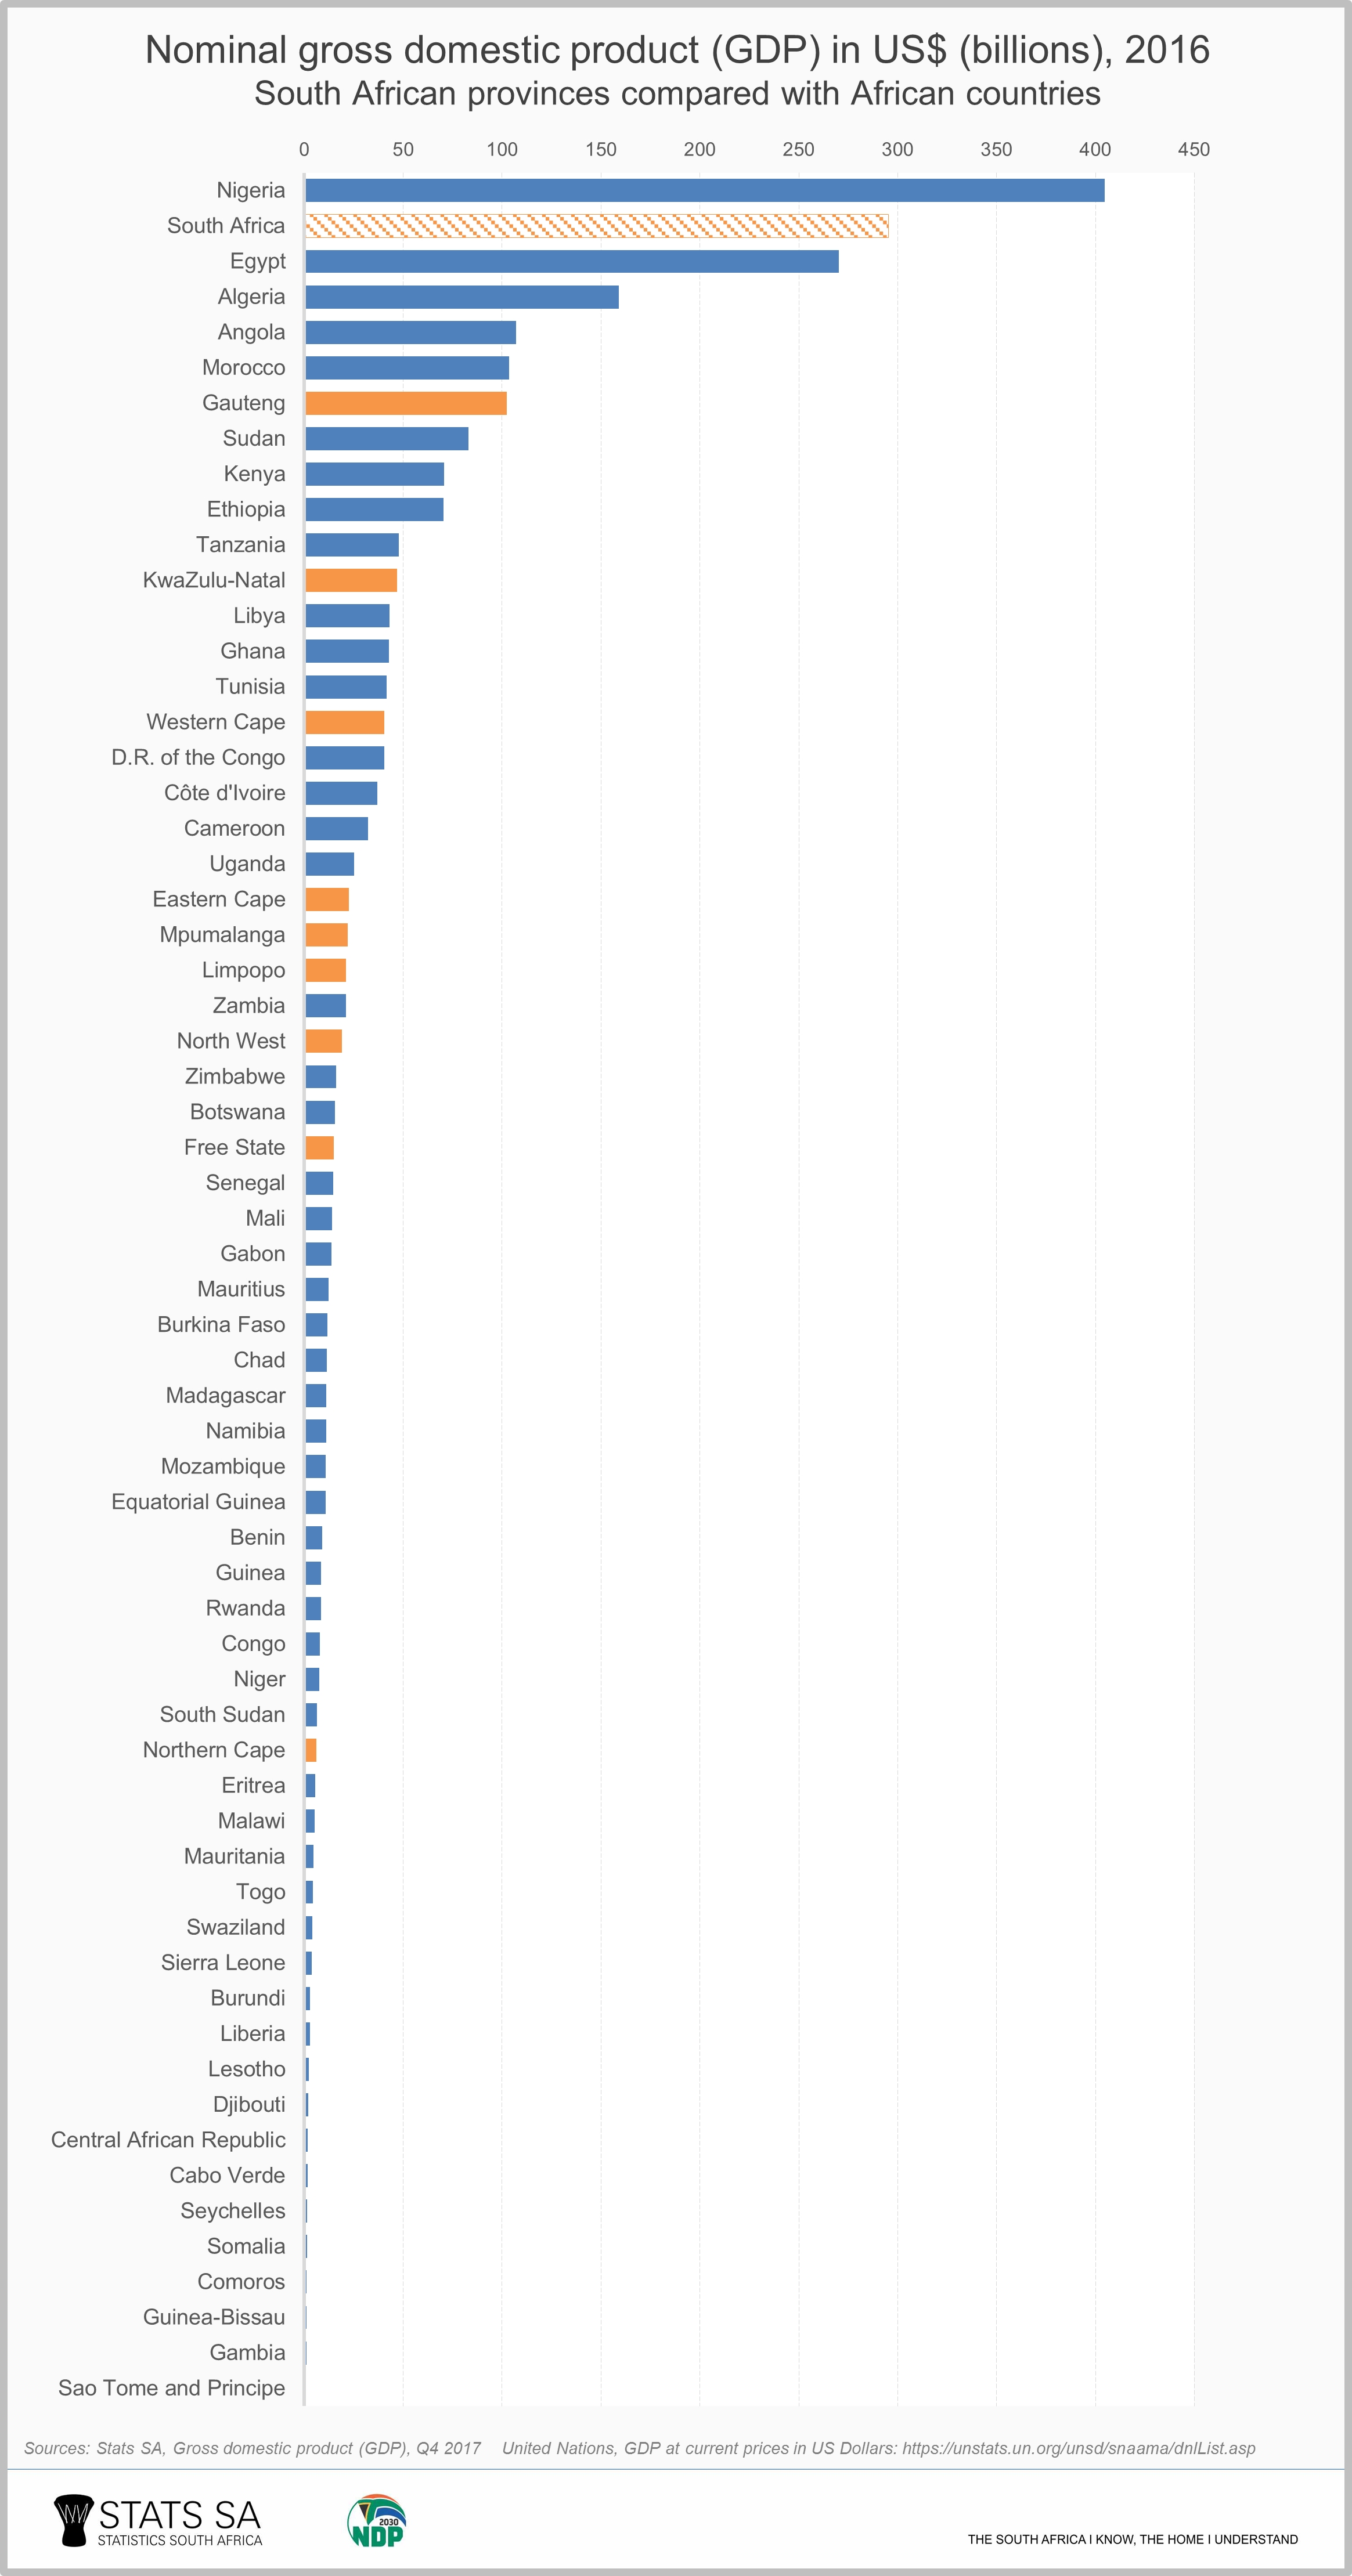
An important point to keep in mind is that although the economies of Western Cape and the DRC were about the same size, the DRC had a population of 79 million in 2016, according to the United Nations, whereas Western Cape’s population totalled just over 6 million individuals. This is reflected in per capita GDP figures: Western Cape’s per capita GDP is roughly US$6 300, while the DRC lags far behind at US$512.
If we use per capita GDP as a measure across the African continent, the rankings shift significantly. Gauteng moves up to fourth place in terms of the highest GDP per person, surpassing Gabon and Botswana, but lower than Mauritius and Seychelles. If the nine South African provinces were sovereign states, all nine would find themselves in the top 20.
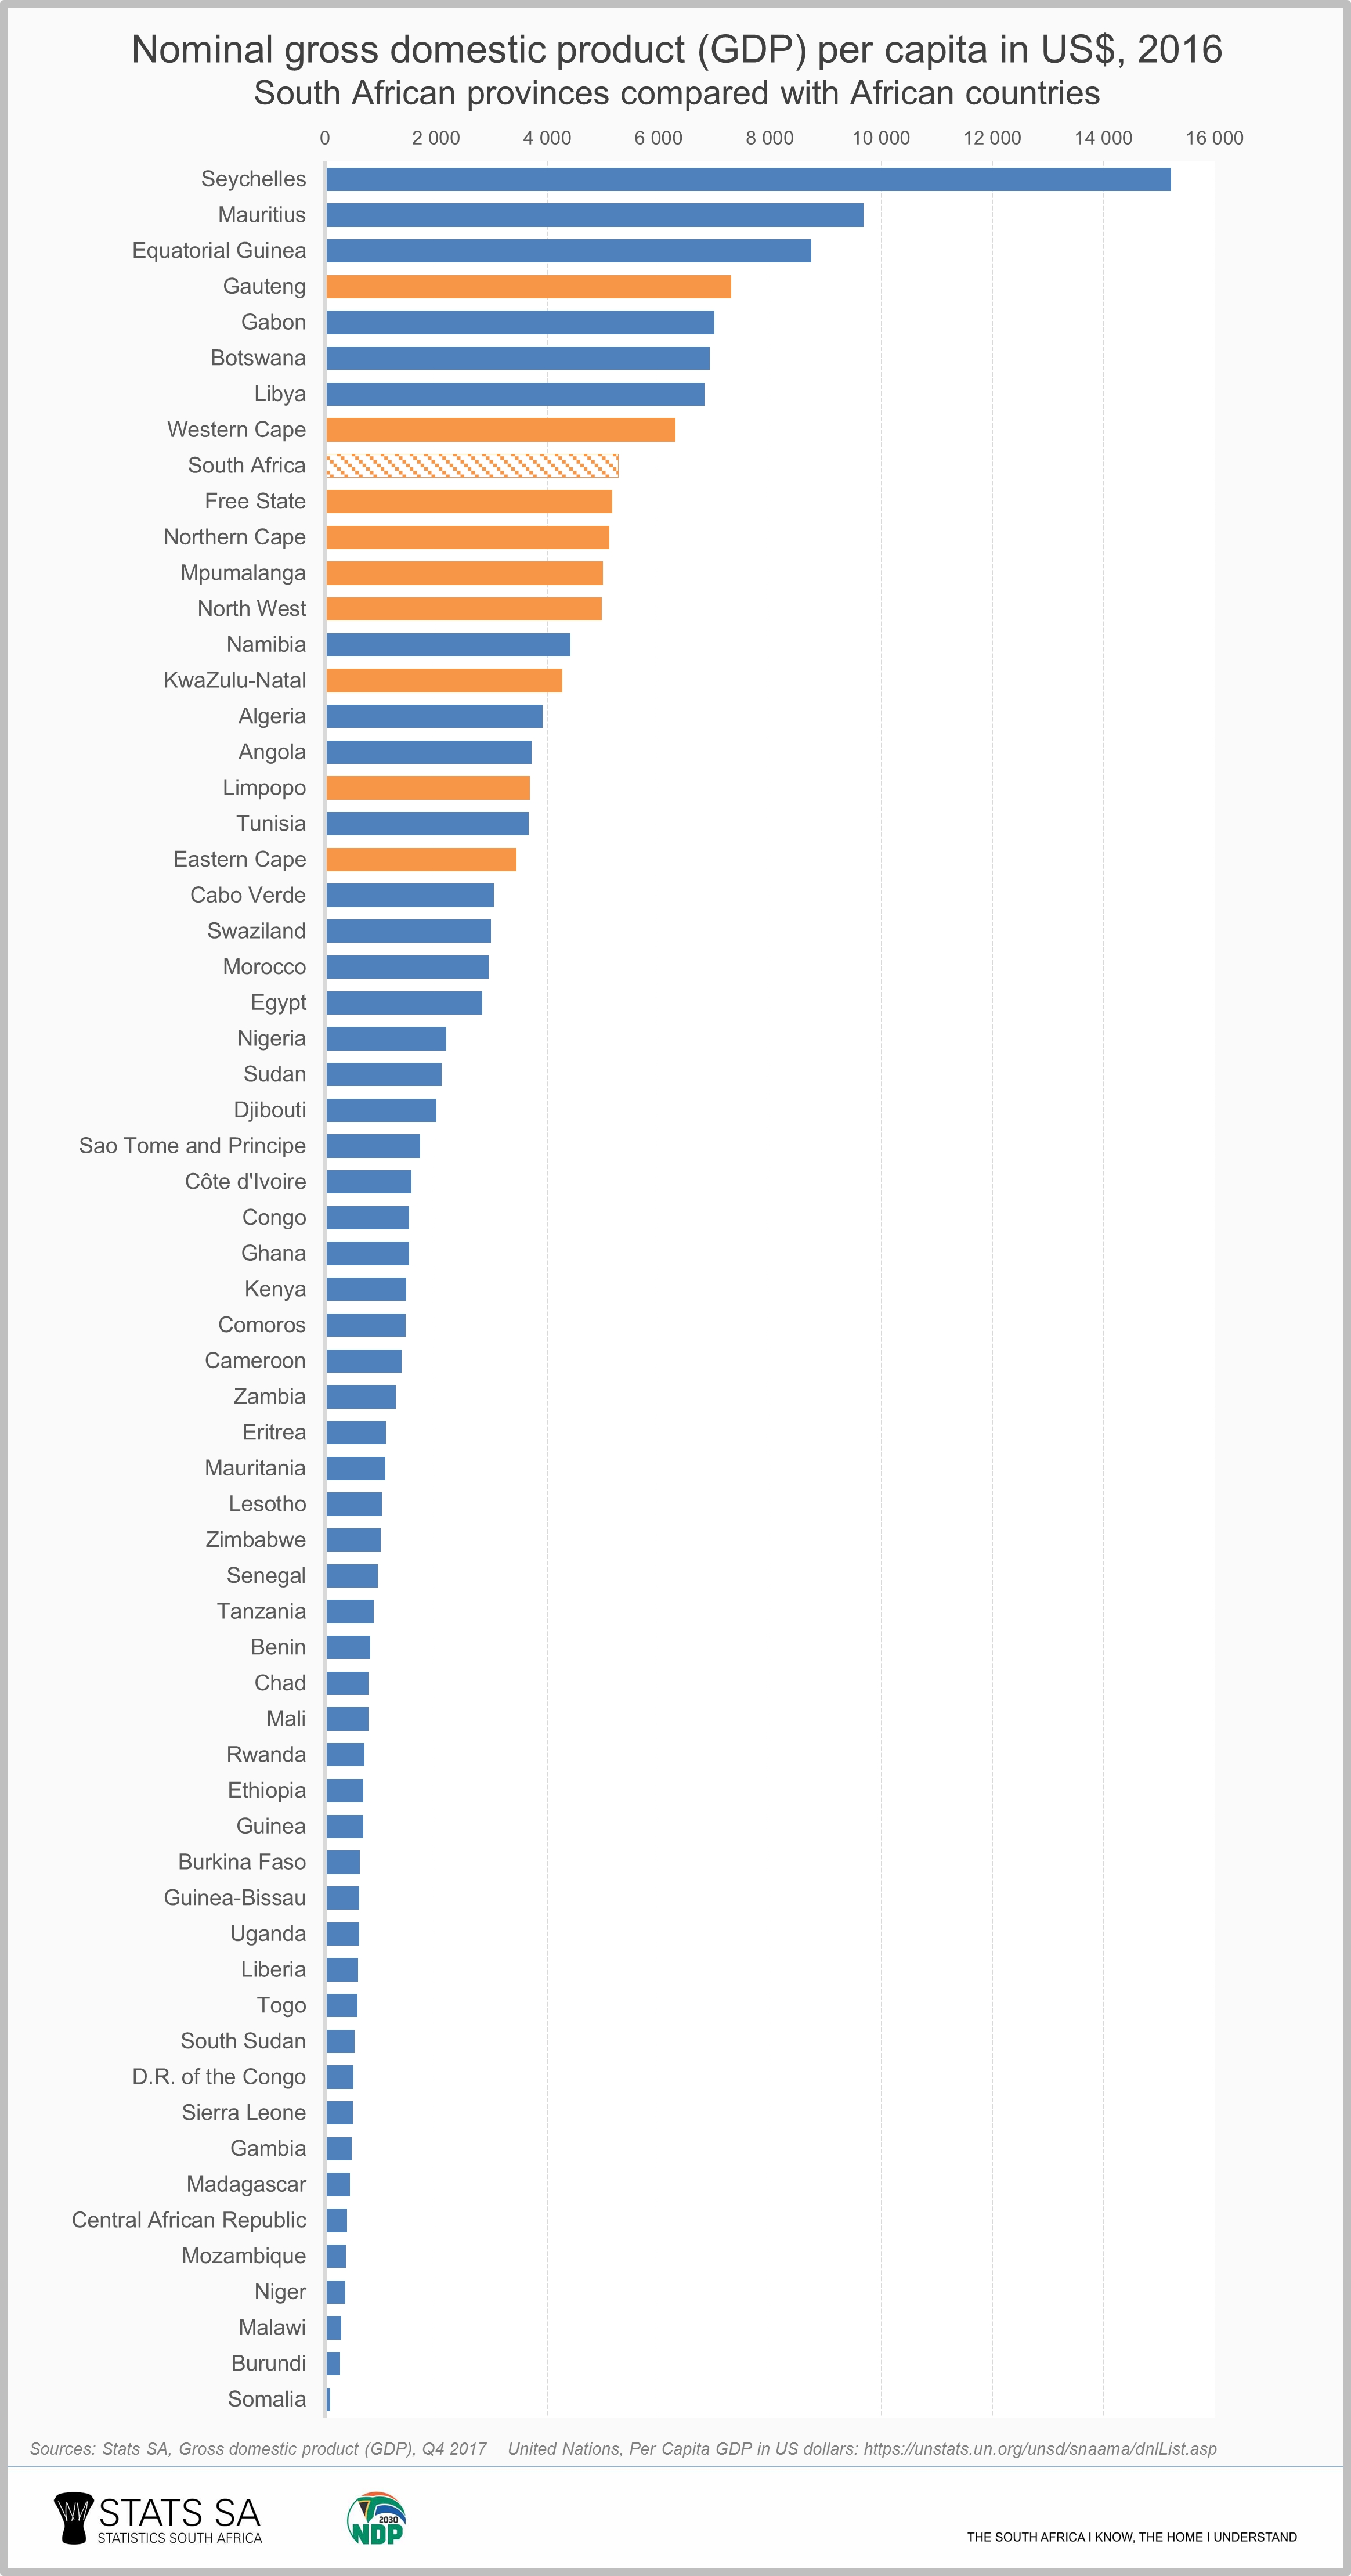
It’s interesting to note that although Nigeria’s economy (nominal GDP) is much larger than South Africa’s, all South African provinces surpass Nigeria on a per capita basis.
At this point you might be wondering how South Africa’s GDP measures up to the economies of wealthier nations. Compared with the largest economy in world, the United States, the South African economy produced about the same level of economic activity as the state of Missouri, the 22nd richest state in the USA.3 The nominal GDP figures from the United Nations ranked South Africa as the 38th largest economy in 2016, smaller than Mexico, Poland and the Philippines; and larger than Egypt, Chile and New Zealand.
1 For a brief overview of the structure of South African provincial economies, see slides 46 to 50 in the GDP media presentation for the fourth quarter of 2017 here. More detailed economic data for provinces are available in Excel format (Tables 16 to 35) here.
2 Provincial contributions to national GDP published by Stats SA were applied to the 2016 United Nations nominal GDP estimate for South Africa for this article. United Nations nominal and per capita GDP estimates for all countries are available here.
3 Nominal GDP figures for all USA states are available here from the Bureau of Economic Analysis.
Similar articles are available on the Stats SA website and can be accessed here.
For a monthly overview of economic indicators and infographics, catch the latest edition of the Stats Biz newsletter here.