
Public healthcare: How much per person?
You can consider yourself one of the lucky few if you have medical aid. According to the latest General Household Survey, only 17 in 100 South Africans have medical insurance, the essential key that opens the door to private healthcare. As many as 45 million, or 82 out of every 100 South Africans, fall outside the medical aid net, and as a result are largely dependent on public healthcare.1
The lack of medical cover is expressed in the decisions that families make. When asked, seven in every ten households choose to go to a public clinic or public hospital as their first point of access if a household member becomes ill. Only a quarter of households opted to go to a private institution.1
It’s no wonder then that healthcare is a high priority for public-sector spending. For every rand that the South African government spent in 2014/15, 11 cents went to healthcare, totalling R157 billion.2 This makes healthcare the fourth largest item of government expenditure, superseded by education (19 cents), social protection (13 cents), and executive and legislative organs (13 cents).
Who spends this money? The bulk, 86% in fact, was spent by provincial government,3 which is tasked to manage the nation’s public healthcare system, comprising 422 hospitals and 3 841 clinics and health centres.4
Updated information in Stats SA’s latest Financial statistics of provincial government sets the healthcare bill for provincial government at R150 billion for 2015/16. This translates to R3 332 spent per person for the 45 million who do not have medical cover.
By province, the Northern Cape government comes out as the top healthcare spender, setting the bar at R4 082 per person in 2015/16. Western Cape takes second spot, followed by Free State and KwaZulu-Natal (click on the image to enlarge).
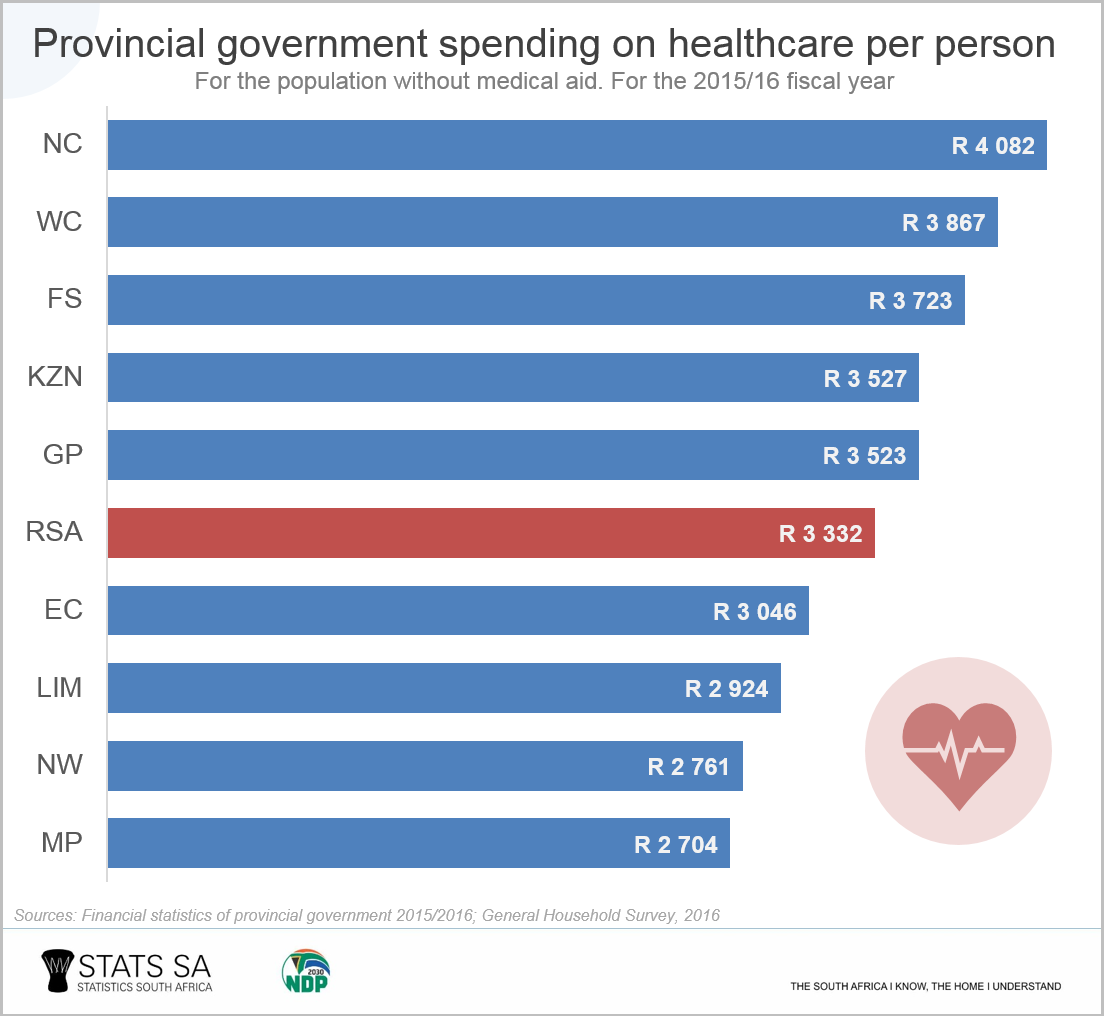
Of course, these figures are averages. They don’t take into account the finer details of healthcare spending within each province, those instances where a person with medical aid uses a public hospital, and the extent to which public healthcare facilities are used (e.g. the number of patients).
What is this money spent on? Using the functional classification outlined in the Government Finance Statistics Manual, the main expenditure items were hospital services (62% of the R150 billion), public health – which includes services such as family planning and disease detection (33%) – and ambulance services (4%).
Another way to look at expenditure is to classify it economically. This shows that the public healthcare system spent two-thirds of the R150 billion on paying its employees, and almost a third on purchasing goods and services.
With slow economic growth, and recent news reports of possible budget cuts in public healthcare,5 it remains as important as ever to ensure the effective allocation of resources within the healthcare system to provide adequate services for those without medical insurance.
Download the latest the Financial statistics of provincial government, 2015/2016 report here.
1 Stats SA, General Household Survey, 2016. Table 7 (download here). The 82 in 100 South Africans without medical aid excludes those who indicated that they don’t know if they have medical aid, and those classified as ‘unspecified’.
2 Stats SA, Financial statistics of consolidated general government 2014/2015. Table B (download here).
3 Stats SA, Financial statistics of consolidated general government 2014/2015. Disaggregated data, Table B (download here).
4 Health Systems Trust, South African Health Review 2017. Table 42 (download here).
5 Major cuts on health budget (read here).
Similar thematic stories are available on the Stats SA website and can be accessed here.