
Electricity: big business for municipalities
The recent power blackout in Msunduzi municipality again highlights the importance of electricity supply. Large parts of Pietermaritzburg were plunged into darkness for about a week when saboteurs, suspected to be striking workers, disrupted the city’s power grid2.
It might be common knowledge that municipalities are involved in power distribution in South Africa, but many might not know to what extent. Acting as intermediaries, municipalities buy electricity from Eskom and then re-sell it to their customers, such as homes, businesses and other institutions.
According to Eskom’s latest integrated report, 42% of the electricity it generated in 2015/16 was rerouted through municipalities in this way. There are customers, however, that Eskom services directly, such as industry (23%), mines (14%), residential areas not serviced by municipalities (6%), neighbouring countries (6%), and other users (9%)3.
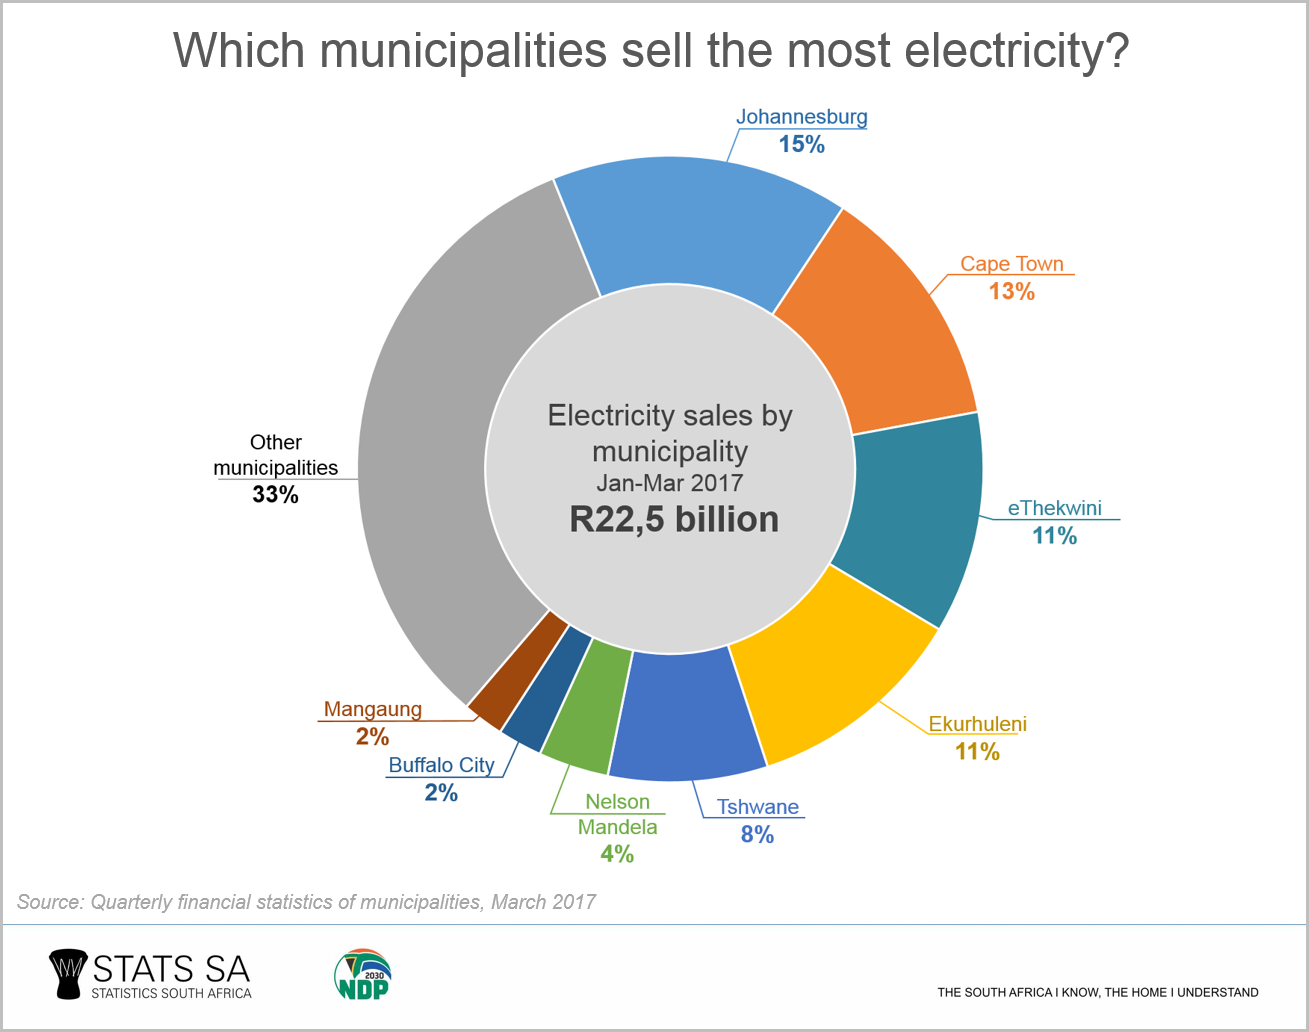
Trading electricity is big business for local government, according to Stats SA’s latest Quarterly financial statistics of municipalities report1. South Africa’s 2574 municipalities earned just over a quarter of their total income (R22,5 billion) from selling power in the first quarter of 2017. With R15,7 billion spent to purchase the electricity from Eskom, municipalities were left with a R7 billion surplus, precious additional money that can be used to fund other municipal activities.
For some, electricity is a means of survival. By way of illustration, for every R1 generated by the Greater Kokstad municipality, 93 cents of its income was from electricity sales. Another example of heavy dependence was the Gamagara local municipality, in the Northern Cape, with 72% of its income coming from the sales of electricity in this quarter.
In the case of Msunduzi local municipality, half of its income was from electricity sales.
What is striking is the dominance of the metropolitan municipalities. They traded just over two-thirds (about R15 billion) of all electricity sold by local government institutions in the first quarter of 2017, despite only 40% of South Africa’s population residing in these areas. The higher concentration of economic activity in these cities drives higher electricity demand, compared to smaller and more rural municipalities.
Johannesburg sold the highest amount of electricity, contributing 15% of the national total, followed by Cape Town, eThekwini and Ekurhuleni.
The metropolitan cities earned 29% of their income, as a group, from selling electricity. The 205 local municipalities were slightly less dependent, with electricity contributing 27%.
The significant difference, however, was with the 44 district municipalities. Only one district made money off electricity, uMkhanyakude in KwaZulu-Natal; a minuscule 0,6% of its total income.
It’s not that district municipalities are slacking at their job. The districts perform a different role and are often not directly involved in service delivery. Instead, they provide an oversight role for local councils.
How much money did municipalities make off the electricity trade? If we examine the surpluses earned from purchases and sales, metropolitan municipalities again came out on top. For every rand of electricity purchased in the first quarter of 2017, the eight largest cities earned R1,50 through sales. Local municipalities earned R1,30.
South Africa’s 257 municipalities play a vital role. Not only do they interact with citizens at a local level, but local and metropolitan councils are primarily responsible for ensuring that millions of homes across the country have access to basic services, such as water and – in this case – electricity.
It would be wise then to keep a close eye on how well local government is functioning. Stats SA provides the facts that enable government to do just this. Regular indicators on municipal services (Non-financial census of municipalities), municipal finances (Quarterly financial statistics of municipalities and Financial census of municipalities), and government investment in infrastructure (Capital expenditure by the public sector) are published on a quarterly and annual basis.
1 The Quarterly financial statistics of municipalities survey collects income and expenditure information on the municipalities’ various services*. The report provides information on where municipalities source their income, and what they spend money on. Download latest report here.
2 More information on the Msunduzi power blackout is available here.
3 Eskom, Integrated report for 2016, Page 9 (available here).
4 Three municipalities did not furnish information for this quarter: Kai Garib, Musina and Lephalale. The figures for these were estimated.
*Information with regard to the municipalities’ quarterly balance sheet is not collected due primarily to that information not being available within the timeframe of the QFSM publication.
Similar thematic stories are available on Stats SA’s website and can be accessed here.