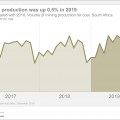
Mining loses shine for the second year in a row
Exactly a week after delegates closed the 26th Investing in African Mining Indaba, Stats SA released data on the performance of the mining industry in 2019. The level of production was 1,3% lower in 2019 than 2018, which in turn was 2,1% lower than 2017. Despite a positive showing from both copper and manganese, a read more »
Statistics South Africa (Stats SA) Census 2021 Mini Test Phase 2 begins
Fieldworkers from Statistics South Africa (Stats SA) will be collecting data from Special Dwelling Institutions (SDIs), the transients, homeless and population in dwelling units from 15 February to 13 March 2020 during the Census 2021 Mini Test – Phase 2. The test will be conducted in selected areas in Bojanala, Buffalo City, Capricon, City of read more »
Quarterly Labour Force Survey (QLFS) – Q4:2019
MEDIA RELEASE 11 February 2020 Quarterly Labour Force Survey (QLFS) – Q4:2019 The results of the Quarterly Labour Force Survey (QLFS) for the fourth quarter of 2019 indicate that the official unemployment rate remained unchanged (29,1%) compared to read more »
Statistics South Africa to release the Quarterly Labour Force Survey (QLFS), 4th Quarter 2019
MEDIA ADVISORY 06 February 2020 Statistics South Africa to release the Quarterly Labour Force Survey (QLFS), 4th Quarter 2019 Statistics South Africa (Stats SA) will release the results of the Quarterly Labour Force Survey (QLFS) for the 4th quarter of 2019 at a media briefing to be held on Tuesday,11 February 2020 in Pretoria. The read more »
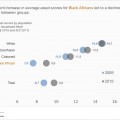
HOW UNEQUAL IS SOUTH AFRICA?
South Africa is known as one of the most unequal countries in the world, reporting a per-capita expenditure Gini coefficient of 0,67 in 2006, dropping to 0,65 in 2015. This is according to the Inequality Trends in South Africa report released by Stats SA. According to the Palma ratio, the top 10% of the population read more »
Help us serve you better
Based on your experience of using our statistics and interacting with us in the past year, rate your satisfaction with our products and information services, and tell us what you think of Stats SA in general. Please complete the survey (approximately 15 minutes) and help us to serve you better. Start survey
Stats Biz – January 2020
Stats Biz kicks off 2020 with a look at the latest inflation figures. Annual consumer inflation edged up to 4,0% in December from November’s 3,6%. Bread and cereal prices continue to place pressure on overall food inflation, increasing by 8,0%, which was unchanged from November. Explore inflation, as well as other stories, in this edition read more »
Stats SA’s NHTS aims to inform transport planning
MEDIA RELEASE 29 January 2020 Stats SA’s NHTS read more »
National Household Travel Survey (NHTS)
Travel is a necessity South Africans travel from their homes to places of work, education, healthcare, for business, for leisure and social activities daily. Travel is a necessity. The increase in urbanisation and population numbers changes the demand for urban infrastructure and transport services. But, how can we know and understand transport needs and behaviour read more »
Inflation quickens slightly in December
Annual consumer inflation edged up to 4,0% in December from November’s 3,6%. The main contributors to the 4,0% rate were food and non-alcoholic beverages; housing and utilities; transport; and miscellaneous goods and services. The food and non-alcoholic beverages category recorded an annual rate of 3,9%, slightly higher than the 3,5% recorded in November. Bread and read more »

