Mid-Year Estimates 2016

The South Africa I know,

The Home I Understand

Results for: northern cape

Mid-Year Estimates 2016

Mid-Year Estimates 2016

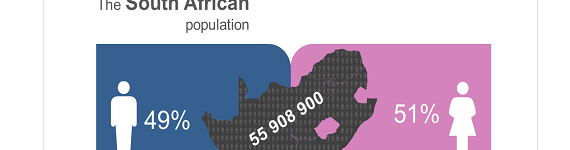
55,9 million people in South Africa:  Planning for a better tomorrow The population of South Africa is estimated to be 55, 9 million by end June 2016. Between 2002 and 2016 South Africa experienced a positive population growth year on year. Between 2002 and 2016, there was an overall increase in Life expectancy (55,2 to   read more »


Media Release: Free State Community Survey 2016 results

  Free State Community Survey 2016 results The total population recorded for Free State in 2016 was 2,8 million, an increase from the population of 2,7 million in 2011, making it the second smallest province in the country in terms of population size, after the Northern Cape.  58,3% of the population in the province are   read more »


Construction: what are the costs per square metre?

Construction: what are the costs per square metre?

Stats SA distinguishes between various types of construction activities, including free-standing houses, townhouses, flats, offices and shopping space. The following infographic shows which of these are the most costly to build, according to Stats SA’s latest Selected building statistics of the private sector as reported by local government institutions. Nationally, it would cost you an   read more »


Media Release: Community Survey 2016 Results

Media Release                                                                                                 30 June 2016 Community Survey 2016 results The population of South Africa has increased to 55,7 million in 2016 from 51,8 million in 2011, representing an increase of over 3 million. Of the 55,7 million people living in South Africa, a majority reside in Gauteng (13,4 million), followed by KwaZulu-Natal (11 million)   read more »


How much do municipalities spend on salaries?

How much do municipalities spend on salaries?

Municipalities spend more money on their employees than on any one of the services provided to their clients/customers. Data from Stats SA’s latest Financial census of municipalities provides interesting insight into the patterns of salary costs across municipalities, as well as over time. Salary patterns across space Employee-related costs took up the largest chunk of   read more »


What municipalities say about service delivery: the supply-side approach

What municipalities say about service delivery: the supply-side approach

If you are interested in the extent of service delivery in South Africa, it might be good to know that it can be measured from two different fronts. In most instances, the extent of service delivery is measured from the demand side. Surveys such as the Population Census, Community Survey (CS) and General Household Survey   read more »


South Africa Demographic and Health Survey (SADHS): Appeal for participation as Publicity Officers hits the field

South Africa Demographic and Health Survey (SADHS): Appeal for participation as Publicity Officers hits the field

Statistics South Africa (Stats SA), in collaboration with the South African Medical Research Council, will be conducting a South African Demographic and Health Survey (SADHS) on behalf of the National Department of Health. The survey will run from June to November 2016. The survey aims to provide a better understanding of the health status of   read more »


South Africa Demographic and Health Survey (SADHS)

South Africa Demographic and Health Survey 2016 Statistics South Africa (Stats SA) is conducting the South Africa Demographic and Health Survey (SADHS) 2016 in partnership with the National Department of Health and the South African Medical Research Council. The survey will be conducted from May to November 2016. The survey aims to provide a better   read more »


ISIbalo -1: African Statistical Research & Development

ISIbalo – 1: African Statistical Research As African economies wrestle with the lessons learned from the global financial crisis and ongoing instability, central to producing statistics that can adequately respond to measurement, monitoring and evaluation challenges in key policy areas informed by national development plans, the Sustainable Development Plans and African Frameworks like Agenda 2063.   read more »


Vulnerable Groups Series I:  The Social Profile of Youth, 2009–2014

Vulnerable Groups Series I: The Social Profile of Youth, 2009–2014

Media Release 18 April 2016 Vulnerable Groups Series I: The Social Profile of Youth, 2009–2014   According to the Vulnerable Groups Series I: the social profile of youth, 2009-2014 the number of young people living below the poverty line decreased across all provinces; with Free State, Limpopo, and Northern Cape leading the pack with declines   read more »


Report-11-02-04 - Census of Agriculture Provincial Statistics: Financial and production statistics: Northern Cape

This provincial report contains detailed results of the census of agriculture, for the Northern Cape province. It has information on the financial performance of all farmers registered for VAT, and the production performance of all farmers who responded to the census. Also see statistical release P1101 - Agricultural Census (Census of Commercial Agriculture) and the national Report No. 11-02-01 - Financial and production statistics ( Census of Commercial Agriculture) read more »


Report 03-01-14 - Community Survey 2016 Provincial profile: Northern Cape

Community Survey 2016 Provincial profile: Northern Caperead more »


Report-03-01-29 - Community Survey, 2007 Basic Results : Northern Cape

Community Survey, 2007 Basic Results : Northern Caperead more »


Report-00-91-03 - Provincial Profile - Northern Cape

This report includes information on population, language, age group, tourism, housing, education, labour, transport, mining, construction and the service sectors for Northern Cape, drawn primarily from Census 96 and the October Household Survey. read more »


Report-03-02-10 - Primary tables Northern Cape: Census 1996 and 2001 compared

This publication consists of detailed tables from both Census 1996 and Census 2001 giving number and percentage information for each of 23 person and household variables broken down by sex and population group. For each topic there is a comparative graph and a short narrative. read more »


Mangaung

Mangaung Metropolitan Municipality is a Category A municipality. It is situated in the Free State province, in the central interior of South Africa.  The Free State is bordered by Gauteng, the Eastern Cape, Northern Cape, KwaZulu-Natal and North West provinces, as well as the neighbouring country of Lesotho.

Mangaung, meaning “the place of the cheetah”, accentuates the vibrant, dynamic and energetic character of the tourism industry in the “City on the move (at the heart of it all)”.  The economy is strongly driven by the government sector, which has seen the fastest growth in the last five years as a result of increased government programmes in livelihoods improvement interventions.  The finance sector is the second-fastest growing sector due to very active estate and construction activities. Small businesses have a major role to play in the Mangaung economy, in terms of employment creation, income generation and output growth.

Cities/Towns: Bloemfontein, Botshabelo, Mangaung, Thaba Nchu Main Economic Sectors: Government services, finance

read more »


Naledi

Naledi Local Municipality (NW392) covers a total area of approximately 7,258 km². This land mass is 15% of the total area of the Dr. Ruth S Mompati District Municipality area. The administrative centre of the municipality is in the town of Vryburg. The town of Vryburg is considered the agricultural and industrial centre of Dr Ruth S Mompati District Municipality. The town is the host to the 3rd largest agricultural show in South Africa, namely Vryburg Show, which attracts farmers from almost all provinces in the country as well as farmers from the neighbouring countries such as the Republic of Namibia and Botswana. This makes the municipality the main employer within the district and most significant contributor to GDP. Naledi Local Municipality is separated into five main places, namely, Vryburg town, Huhudi township, Colridge township, Stella, Devondale and Dithakwaneng village. The municipal area is surrounded by the other three local municipalities within the district, namely, Greater Taung Municipality (70km), Kagisano Molopo Municipality (70km) and Mamusa Municipality(70km). The town of Vryburg is about 140km away from Kuruman town in the Northern Cape Province and 160km from Mahikeng municipality, the administrative centre of the North West Province. The municipality is divided into 9 administrative wards and has a total of 18 ward councillors (ward councillors and their assistants/PR councillors).  read more »


Greater Taung

Greater Taung Local Municipality (NW 394) is situated in the western part of North West in the area of jurisdiction of Dr Ruth S Mompati District Municipality. The municipality is one of the five local municipalities in Dr Ruth S Mompati District Municipality.The municipality covers an area of 5 639 Km2, which accounts for 11,8 % of the total area of Dr Ruth S Mompati District Municipality.The main rural towns/townships in the municipal area are Reivilo, Pudimoe and Taung Central. About 95% of the municipal area is predominantly rural. There are about 106 widely-scattered villages in the municipal area. There are Northern Cape areas that one passes when going from one village to the other within the municipality, namely Pampierstad township and Northern Cape farms. These areas previously formed part of the municipality but were later moved to the Northern Cape during the last demarcation process. The municipality is divided into 26 administration wards and has a total of 52 councillors (both ward and PR councillors). As the municipality is predominantly rural, villages have been divided under the three tribal authorities under three paramount chiefs, namely Mankuroane, Mothibi and Motlhabane. The agricultural sector, both commercial and subsistence, is the major employer and contributor to the municipal economy. The municipal population stands at 177 642 (the largest in the district), with a total of 48 612 households.When compared to the 2001 population statistics, the population size has declined from a total of 182 164 to 177 642 in 2011. The average population density stands at 31,5km2.read more »


Kagisano Molopo

Kagisano Molopo Local Municipality (NW397), is approximately 23 827 km².The municipal name, Kagisano Molopo, emanates from two former local municipalities, namely Kagisano and Molopo, which were mergedon 18 May 2011 to form what is now known as Kagisano Molopo Local Municipality (KMLP). The local municipality is located at the north-western corner of the NorthWest province.It borders the Republic of Botswana to the north, Joe Morolong Local Municipality in the Northern Cape to the south-west,Naledi Local Municipality to the south-east, and Ratlou Local Municipality to the east. For the year 2013/14, the municipality runs at an estimated overall budget of R110 million (source: Kagisano Molopo IDP, 2012-2017). Kagisano Molopo Local Municipality is a 100% rural municipality which consists of 77 villages under the leadership of a single paramount chief. There are seven local chiefs who operate from seven areas/villages, namely Morokweng, Tlakgameng, Tseoge, Mmadinonyane, Phaposane, Mabane and Kgokgoje villages. The 77 villages are divided into 15 political wards with a total of 30 ward councillors. Kagisano Molopo is the second largest local municipality in terms of population size within Dr Ruth SegomotsiMompati District. As per Census 2011 results, the total population stood at 105 789, which constitutes 22,8% of the entire district’s population. The municipal population size increased from 100 469 in 2001 to 105 789 in 2011.read more »


Richtersveld

The Richtersveld Local Municipality is located in the Namakwa District in Northern Cape. It is a unique landscape surrounded by a variety of contrasts. In Port Nolloth you’ll find the ocean, from a distance it looks like a glowing body that lies stretched out before you. At AlexanderBay the Orange River spews out its last waters. At Lekkersing and Eksteenfontein there’s neither river nor ocean, but underground water that is a little brackish. Rainfall is no familiar face to this area and water is a scarce commodity. We can genuinely say that the Richtersveld is a Conservation area. Not only is the geographical area unique, but also its people, which is why this area must manage its resources in an optimal manner.

read more »


Economic Growth

The diverse structure of the South African economy is a critical aspect of its historical and current growth performance.  The manufacturing sector continues to occupy a significant share of the South Africa economy, despite its relative importance declining from 19 percent in 1993 to about 17 percent in 2012 in real terms.

In line with structural changes in many economies, it not surprising to observe that the finance, real estate and business services sector has increase its relative importance of 17 per cent in 1993 to approximately 24 per cent in 2012. These two sectors and a few more are an important part of the South African growth story since the dawn of democracy.

Despite that, less than a decade into the 21st century, many countries, including South Africa, experienced the global economic crisis.This has affected economic growth in South Africa over the last four years, prompting a deceleration in rate of economic growth.

South Africa experienced an average growth rate of approximately 5 per cent in real terms between 2004 and 2007. However, the period 2008 to 2012 only recorded average growth just above 2 per cent; largely a result of the global economic recession.

Of the nine provinces in South Africa, three power houses stand out. Gauteng, Kwazulu-Natal and Western Cape collectively contribute a significant portion to the country’s value added, reported at over 60 percent.

read more »


Crime statistics

  Crime prevention and ultimate elimination is one of the priority goals of the National Development Plan (NDP). Crime affects all people irrespective of their background, and it is a topic that attracts a lot of media attention. Analysis will show that some groupings are affected by certain types of crime more than others. Crime statistics are essential in order to understand the temporal and spatial dynamics of crime. Such understanding is vital for planning targeted interventions and assessing progress made towards achieving a crime free nation where "people living in South Africa feel safe at home, at school and at work, and they enjoy a community life free of fear. Women walk freely in the streets and children play safely outside". There are two major sources of crime statistics in South Africa, namely the South African Police Service (SAPS) and Statistics South Africa (Stats SA). The other smaller sources such as the Institute for Security Studies (ISS) and the Medical Research Council (MRC) are by no means insignificant, as they provide statistics for types of crime not adequately covered by the major players, such as domestic violence. While the methodologies used by the SAPS and Stats SA are very different, the two institutions produce crime statistics that complement each other. The SAPS produces administrative data of crime reported to police stations by victims, the public and crime reported as a result of police activity. Stats SA produces crime statistics estimated from household surveys. Crimes reported to the SAPS do not always have the same definitions as crime statistics produced from VOCS. In addition, not all crimes reported by the SAPS are reported by VOCS and vice versa. Working in close collaboration with Stats SA, the South African Police Service has undertaken to align its Classification of Crime for Statistical Purposes (CCSP) to the International Classification of Crime for Statistical Purposes (ICCS). Highlights of the 2017/18 Victims of Crime report Aggregate crime levels increased in 2017/18 compared to 2016/17. It is estimated that over 1,5 million incidences of household crime occurred in South Africa in 2017/18, which constitutes an increase of 5% compared to the previous year. Incidences of crime on individuals are estimated to be over 1,6 million, which is an increase of 5% from the previous year. Aggregate household crime levels increased in Free State, KwaZulu-Natal, North West, Gauteng and Mpumalanga. Individual crime levels increased in Free State, North West and Gauteng. North West experienced a drastic increase of 80% in the individual crime level. Perceptions of South Africans on crime in 2017/18 were more skeptical compared to the previous year. About 42% thought property crime increased during the past three years. This is an increase of 6,9% from the previous year. 46% thought violent crime increased during the past three years, an increase of 4,5% over the previous year. Western Cape was the most skeptical about crime trends, as 84% of Western Cape residents thought that crime in South African increased or stayed the same. Mpumalanga was the least skeptical among the nine provinces, where 65% thought that crime increased or stayed the same during the past three years. Crimes that are feared most are those that are most common. An estimated 79% of South Africans felt safe walking alone in their neighbourhoods during the day, which is a decrease of 6,7% from last year. About 32% of South Africans felt safe walking alone in their neighbourhoods at night, constituting an increase of 8% from last year. The highlights for household and individual experiences of crime from the 2016/17 VOCS report are as follows:  read more »