

IMPROVING LIVES THROUGH DATA ECOSYSTEMS
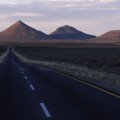
The roads are less travelled
Before you plan your next family holiday, you may want to have a look at the latest Domestic Tourism Survey released by Statistics South Africa recently. While the survey shows a decline in the total number of day trips and overnight trips taken within South Africa since 2013, it also reveals how economic stagnation and read more »
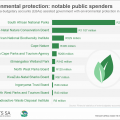
Government spending: how much goes to environment protection?
It goes without saying that the natural environment is extremely important to our well-being. Take our rivers and wetlands, for example. The South African National Biodiversity Institute (SANBI), together with Stats SA and other departments, published a document in 2015 outlining the health of the country’s river and wetland systems. The data do not provide read more »
Poverty Trends in South Africa: An examination of absolute poverty between 2006 & 2015
Media Release 22 August 2017 Poverty Trends in South Africa: An examination of absolute poverty between 2006 & 2015 The proportion of the population living in poverty declined from 66,6% (31,6 million persons) in 2006 to 53,2% (27,3 million) in 2011, but increased to read more »
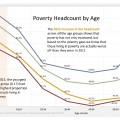
Poverty on the rise in South Africa
Poverty on the rise in South Africa According to new data released by Stats SA, poverty is on the rise in South Africa. The latest “Poverty Trends in South Africa” report shows that, despite the general decline in poverty between 2006 and 2011, poverty levels in South Africa rose in 2015. More than half of read more »
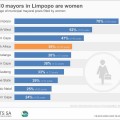
Women in power: what do the statistics say?
The message was clear: “We’ve had enough!” Regarded as one of the largest demonstrations at the time, more than 20 000 women marched to the Union Buildings on 9 August 1956 to protest against the apartheid government’s pass laws. This powerful statement of protest brought the struggle for women’s rights to the fore, and signified a read more »
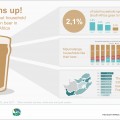
Beer more popular than vegetables
Beer more popular than vegetables Nqa, Impilo, Pholo e ntle, gesondheid, Awe, Cheers! Many of us enjoy a pint, but have you ever really thought much about the industry and what you spend on your beer? In celebration of International Beer Day, we take a closer look at how much households spend on beer and read more »
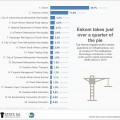
Electricity infrastructure dominates capital spending
Recent data released by Stats SA show that public-sector capital expenditure has risen over the last five years, from a total of R203 billion in 2012 to R284 billion in 2016; an average rise of 8,7% per year. Over R1,2 trillion was spent during this five-year period. Well-maintained infrastructure facilitates trade, improves connectivity, attracts investment, read more »
Postponement of the QLFS Q2:2017 report
MEDIA RELEASE: QLFS POSTPONED 24 July 2017 Postponement of the QLFS Q2:2017 report The release of the Quarterly Labour Force Survey (QLFS) Q2: 2017 results has been postponed to 7 read more »
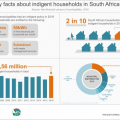
The indigent net widens, but gaps remain
Stats SA’s most recent release of its Non-financial census of municipalities (NFCM)1 report shows an increase in the number of indigent households across the country. South Africa’s 278 municipalities registered 3,56 million indigent households in 2016, the highest number on record since figures were first published by Stats SA in 2004. To put it into read more »
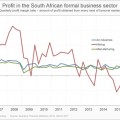
Tighter profits in the formal business sector
The formal business sector, excluding agriculture and banking, generated R2,34 trillion in income during the first quarter of 2017, for the months of January, February and March. On average, that’s R300 560 of income generated every second over that 90-day period. You might be thinking that’s quite a hefty amount. You might catch yourself imagining the read more »