
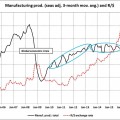
South African manufacturing production and the exchange rate
The South African economy was hit hard by the global economic crisis of 2008/2009. The country’s manufacturing industry contracted sharply, and its subsequent recovery has been insufficient for the volume of manufacturing production to return to its pre-crisis level. Figure 1 shows SA’s manufacturing production (volume) compared with OECD industrial production.1 Preliminary manufacturing data for read more »
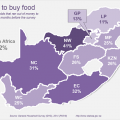
Rising food prices: where are the most vulnerable?
A growing number of forecasts reveal that food prices might rise sharply in coming months. Survey data show which parts of the country are most vulnerable. Current data point to an agriculture industry that is struggling. During November 2015, in the midst of South Africa’s worst drought in 23 years, Stats SA released gross domestic read more »
Stats Biz – January 2016
As a new year begins, Stats Biz takes a look at selected economic stories from 2015. During that year a rumour wobbled an industry; South Africa entered its worst drought in decades; tertiary education was rocked by protests over tuition fees; and the price of cake was most expensive in the Western Cape. Explore these, read more »
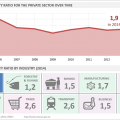
A quick look at debt in the private sector
Data from Stats SA’s Annual financial statistics (AFS) report shows that the debt-to-equity ratio for the private sector as a whole has dropped since 2005. The debt-to-equity ratio is a measure of how much debt a company or industry has incurred to finance its operations relative to equity. Debt refers to how much an industry read more »
RELEASE OF QLFS QUARTER 4 RESULTS DELAYED
The Statistician-General regrets to announce a delay in the release of the fourth quarter report of the Quarterly Labour Force Survey. The release, which was scheduled for Tuesday the 9th of February has been postponed to the 25th of February for the following reasons. The QLFS has run on a redesigned Master Sample for a read more »
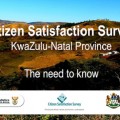
STATS SA HOLDS UP THE MIRROR FOR KWAZULU-NATAL GOVERNMENT
“Our job is only to hold up the mirror – to tell and show the public what has happened.” Walter Cronkite The Statistician-General for South Africa, Dr Pali Lehohla, today handed over the results of the 2015 KwaZulu-Natal Citizen Satisfaction Survey (CSS) to the Premier of KwaZulu-Natal, the honourable Mr Edward Mchunu. Handing over the read more »
South Africa Demographic and Health Survey (SADHS): Dwelling Frame update
Statistics South Africa (Stats SA), in collaboration with the South African Medical Research Council, will be conducting the South Africa Demographic and Health Survey (SADHS) in 2016 on behalf of the National Department of Health. The survey aims to provide a better understanding of the health status of the population in South Africa. Key topics read more »
Stats Biz – November 2015
In honour of World Cake Day on 26 November, we took a look at the latest price data of this popular dessert. How has the price of cake changed over time? In which province is cake most expensive? And how does the price of cake compare to other desserts? Explore the price of cake, and read more »
Stats Biz – October 2015
With the announcement of a zero fee increase for higher education institutions next year (2016), the focus is now on where the money will be sourced to finance the expected shortfall. Recent data provide an indication of which universities are most dependent on tuition fees, and as a result might be most vulnerable to a read more »
Stats Biz – September 2015
The bucket toilet system remains a persistent phenomenon in seven of the nine provinces. Interestingly, 35% of consumer units serviced with bucket toilets in South Africa are concentrated in a single municipality: Nelson Mandela Bay in Eastern Cape. Learn more about the bucket system, and economic related statistics, in this edition of Stats Biz. read more »