
How do we know if the latest GDP estimate was disappointing?
Stats SA publishes estimates of GDP every quarter. It is one of the most anticipated statistical releases on the calendar as it captures the dynamics of the economy in a single number. The key number is expressed as the seasonally adjusted annualised growth between two consecutive quarters, based on GDP in real terms (i.e. volume)1.
But how do we know if the latest GDP was a weak or strong number? There is no easy answer to this question, as a higher number is always preferable. Analysts usually like to put GDP performance into some kind of context by comparing it with historic averages, and/or targets as set out in government plans, and/or the economic performance of major trading partners and other countries in the region or at a similar stage of development.
Interpretation of the quarterly data is further complicated by short-term volatility that can see upward or downward blips that occur for once-off reasons or base effects. So let us rather address the easier question of how to judge when the GDP estimates are unambiguously disappointing, i.e. when the economy has gone into recession.
The generally agreed definition of recession is a fall in GDP (seasonally adjusted) for two consecutive quarters. Typically a decline in one quarter provides a low base, which is favourable for a positive rebound the following quarter; but if the following quarter sees a further dip instead of a rebound, it is a clear indication of distress. ‘Recession’ comes from the Latin ‘recedere’, to recede or go backwards. Figure 1 shows the relevant time-series for South Africa from 1961.
Figure 1: Economic growth, seasonally adjusted and annualised
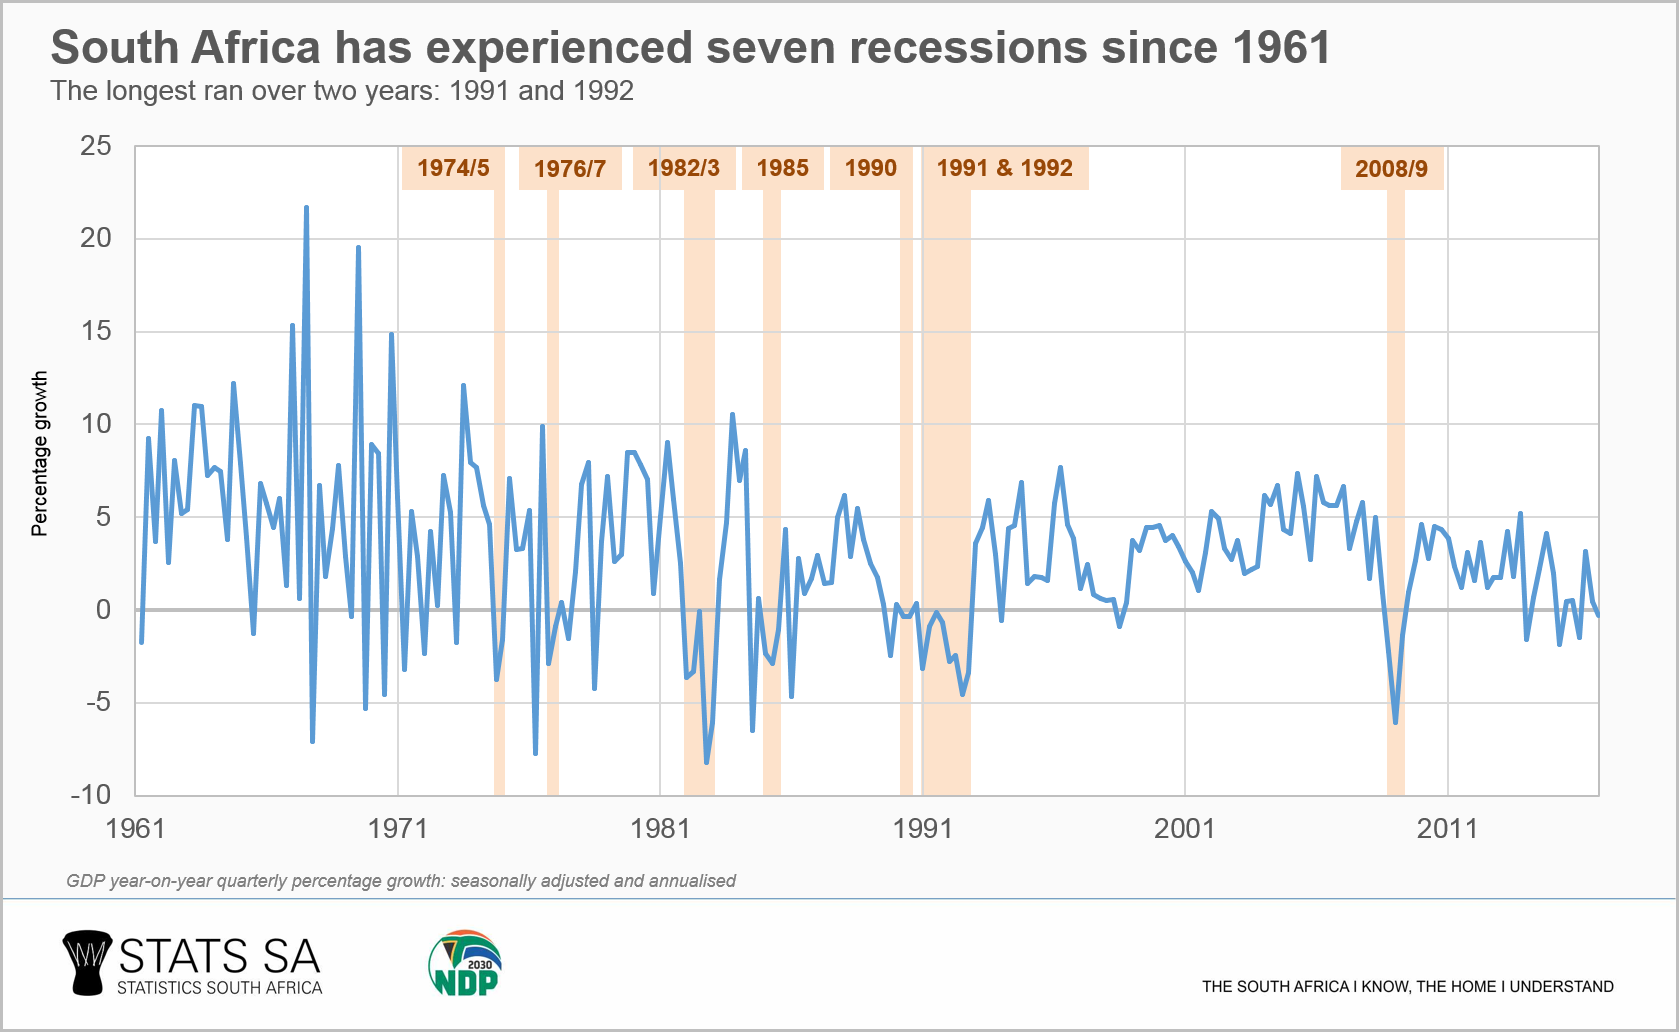
Of the 223 quarters shown in the graph, 46 were negative, but as a recession requires two consecutive negative quarters, the South African economy was only in recession seven times since 1961. The longest recession occurred in 1991–1992 when the economy declined for eight consecutive quarters, linked to a global recession. The most recent recession occurred during 2008/9 at the time of the global financial crisis.
The different components of GDP can also be seen to be in recession or not. This could be the value added originating from a particular industry, or a component of final demand. The agriculture industry is prone to being in recession, given the impact that the weather can have on its performance. In Figure 2, the growth rates in private consumption expenditure by households, the value added by the manufacturing industry as well as total GDP are compared from 2008 to date.
Figure 2: Gross domestic product, household private consumption expenditure and value added by the manufacturing industry (growth rates)
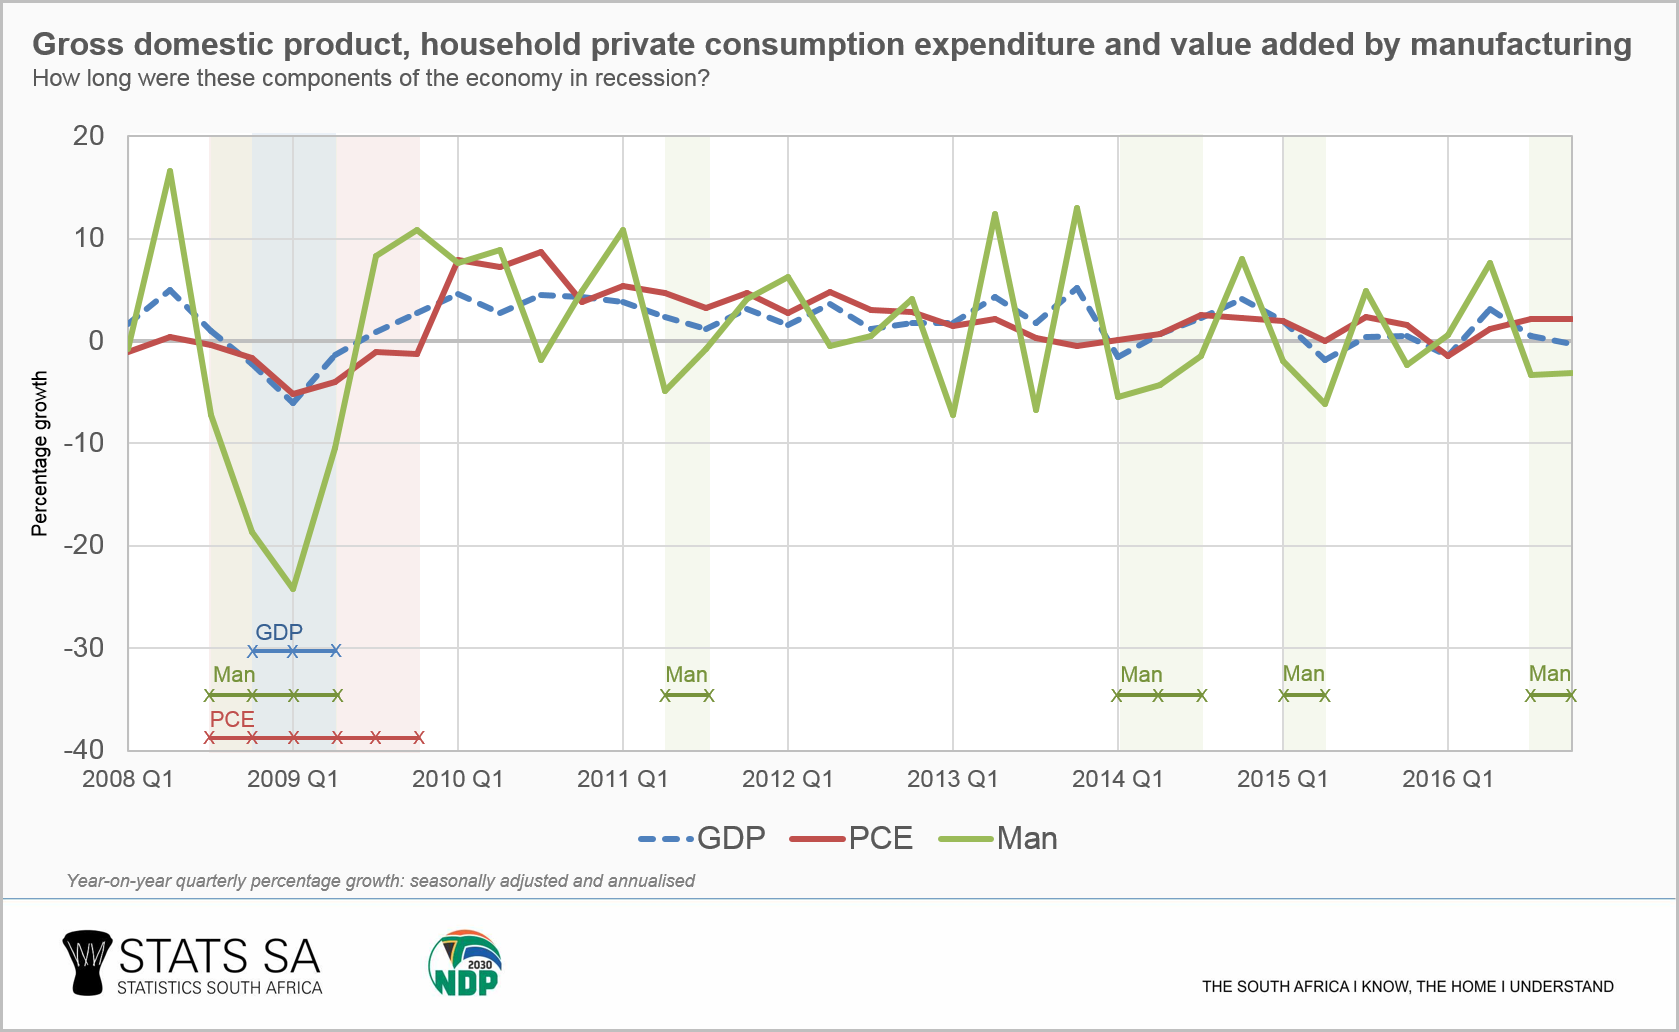
As noted, the economy was in a recession for three quarters in 2008/9. At the time, household consumption was in a recession for six quarters and manufacturing for four quarters. If large components of GDP enter recession, it is likely, but not guaranteed, that the entire economy (in the sense of total GDP) will go into recession as well. Since 2008, household consumption expenditure did not enter into another recession. On the other hand, manufacturing did so on four further occasions.
The recent adverse weather conditions have caused the agriculture industry to be in a recessionary state since the first quarter of 2015.
One objection to the preceding characterisation of GDP growth is that even when GDP is increasing, the outcome is disappointing if the growth rate is very low. Again there is no easy answer to what outcome is low/weak or high/strong, but one measure that economists often turn to is annual GDP per capita. If annual GDP (in volume terms) and population have the same rates of growth, growth in real GDP per capita is zero. If real GDP growth is positive but insufficient to outpace population growth, real GDP per capita falls and once again we’re going backwards. Figure 3 shows the growth rates of both GDP and GDP per capita in volume terms.
Figure 3: Annual real GDP and GDP per capita (growth rates)
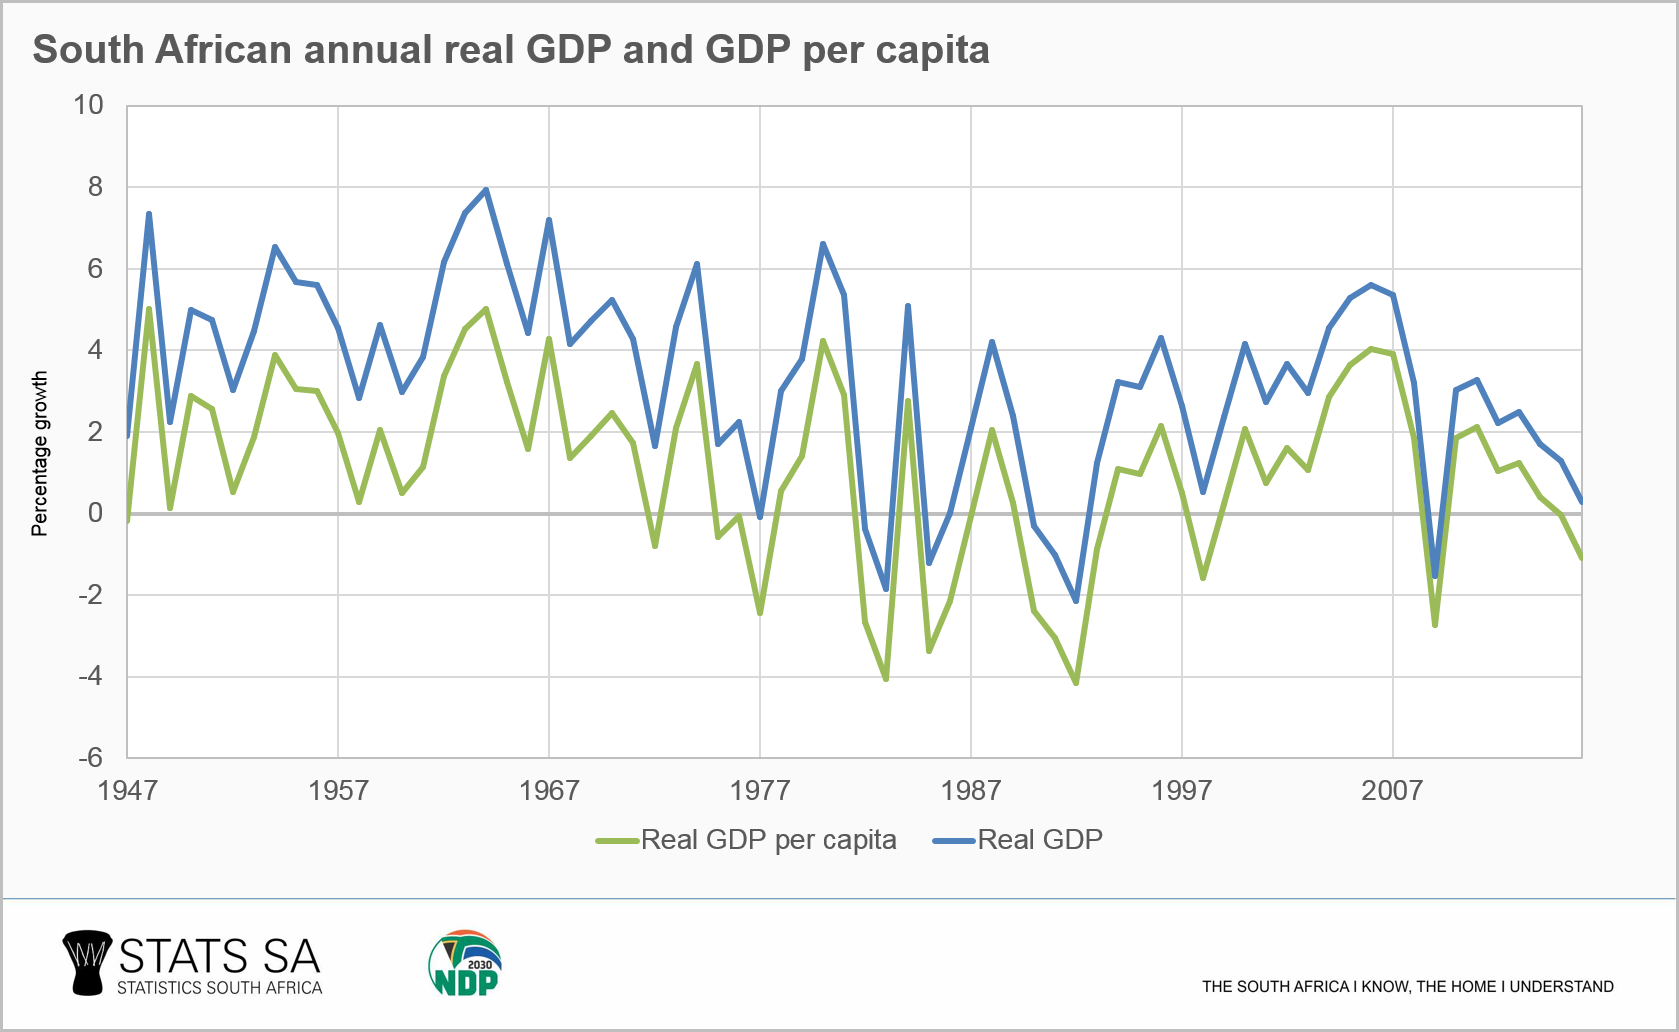
From Figure 3 we see that in all cases when annual GDP was negative, the GDP per capita followed suit. However, in a number of cases, weak (but positive) GDP translates into negative GDP per capita growth. The most recent example was in 1998, when GDP grew at 0,5%, but GDP per capita was -1,6%. More recently, the graph shows that in 2015 and 2016 the annual GDP rates of 1,3% and 0,3% became 0% and -1,1% in per capita terms, respectively.
In summary, there is no clear answer as to when a GDP number is a good or bad outcome. A single number cannot capture all the complexities and contexts associated with the dynamics of the economy. But the widely accepted notion of recession helps us to judge when the economy is clearly heading in the wrong direction, and GDP per capita can tell us when we are going backwards even when we may think we are going forwards.
Stats SA will release the GDP estimates for the first quarter of 2017 on Tuesday, 6 June 2017, which will show whether the economy entered into its 8th recession since 1961.
[Source (time series): SARB. All growth rates are expressed in real terms; quarterly growth rates are seasonally adjusted and annualised.]
1 Seasonal adjustment neutralises the impact of seasonal patterns such as high manufacturing production in October and November; annualisation gives us the annual growth rate that would result from the quarterly rate being repeated for four consecutive quarters.