
Municipalities: where are the staff vacancies?
Recent service delivery protests have shifted the spotlight onto local government’s ability to provide vital services. Are municipalities properly staffed to handle the complexities of service delivery? Stats SA’s latest Non-financial Census of Municipalities report provides a profile of the municipal workforce, shedding light on the number of vacancies in key departments1.
Local government is responsible for ensuring that homes, businesses and industries across South Africa have access to vital services, such as electricity, water and refuse removal. Does your municipality have the staff to ensure that you receive these services? The maps below provide a snapshot2.
Total vacancy rate
Up from 13,3% in 2015 to 14,4% in 2016
There were 314 117 funded posts across local government in 2016. Of these, 45 096 were unoccupied, translating to a national vacancy rate of 14,4%3.
In the map below, municipalities with the highest vacancy rates (49% plus) are indicated in yellow. Emfuleni municipality in Gauteng (the Vereeniging area) had the highest rate: 59% of its 5 438 funded posts were unfilled.
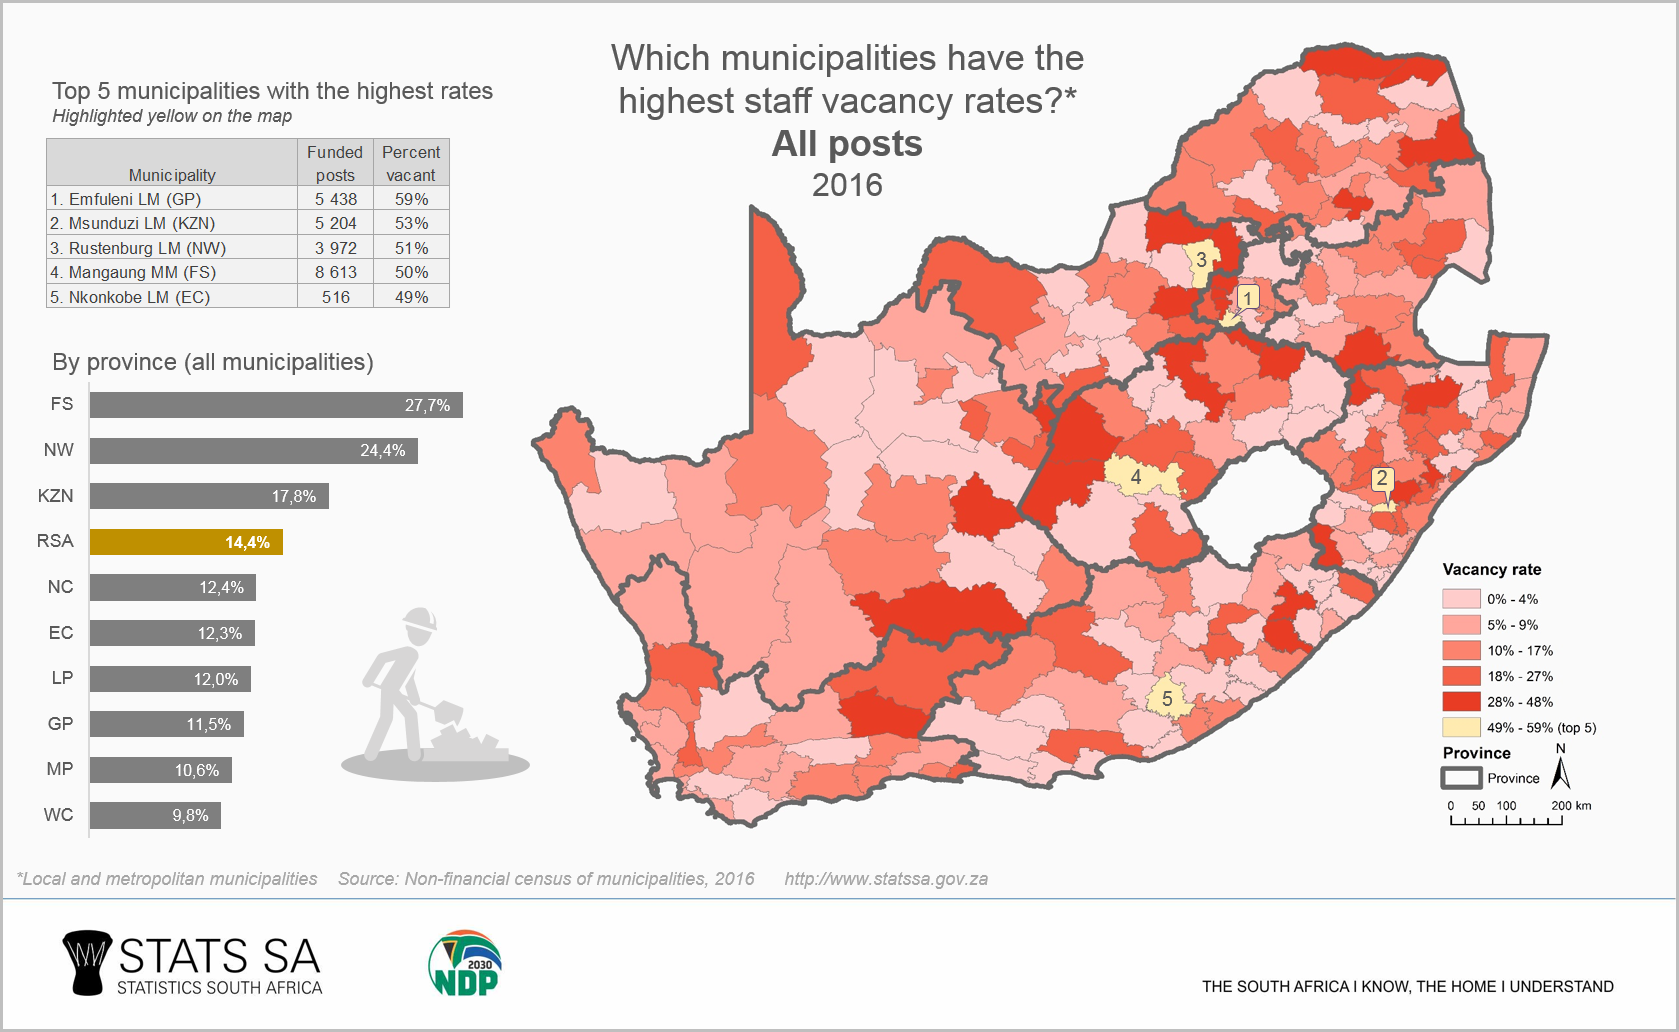
As a group, Free State municipalities had the highest percentage of posts that were unoccupied in 2016.
Broken down by department, the highest vacancy rates were recorded by environmental protection departments, road transport and waste water management departments4.
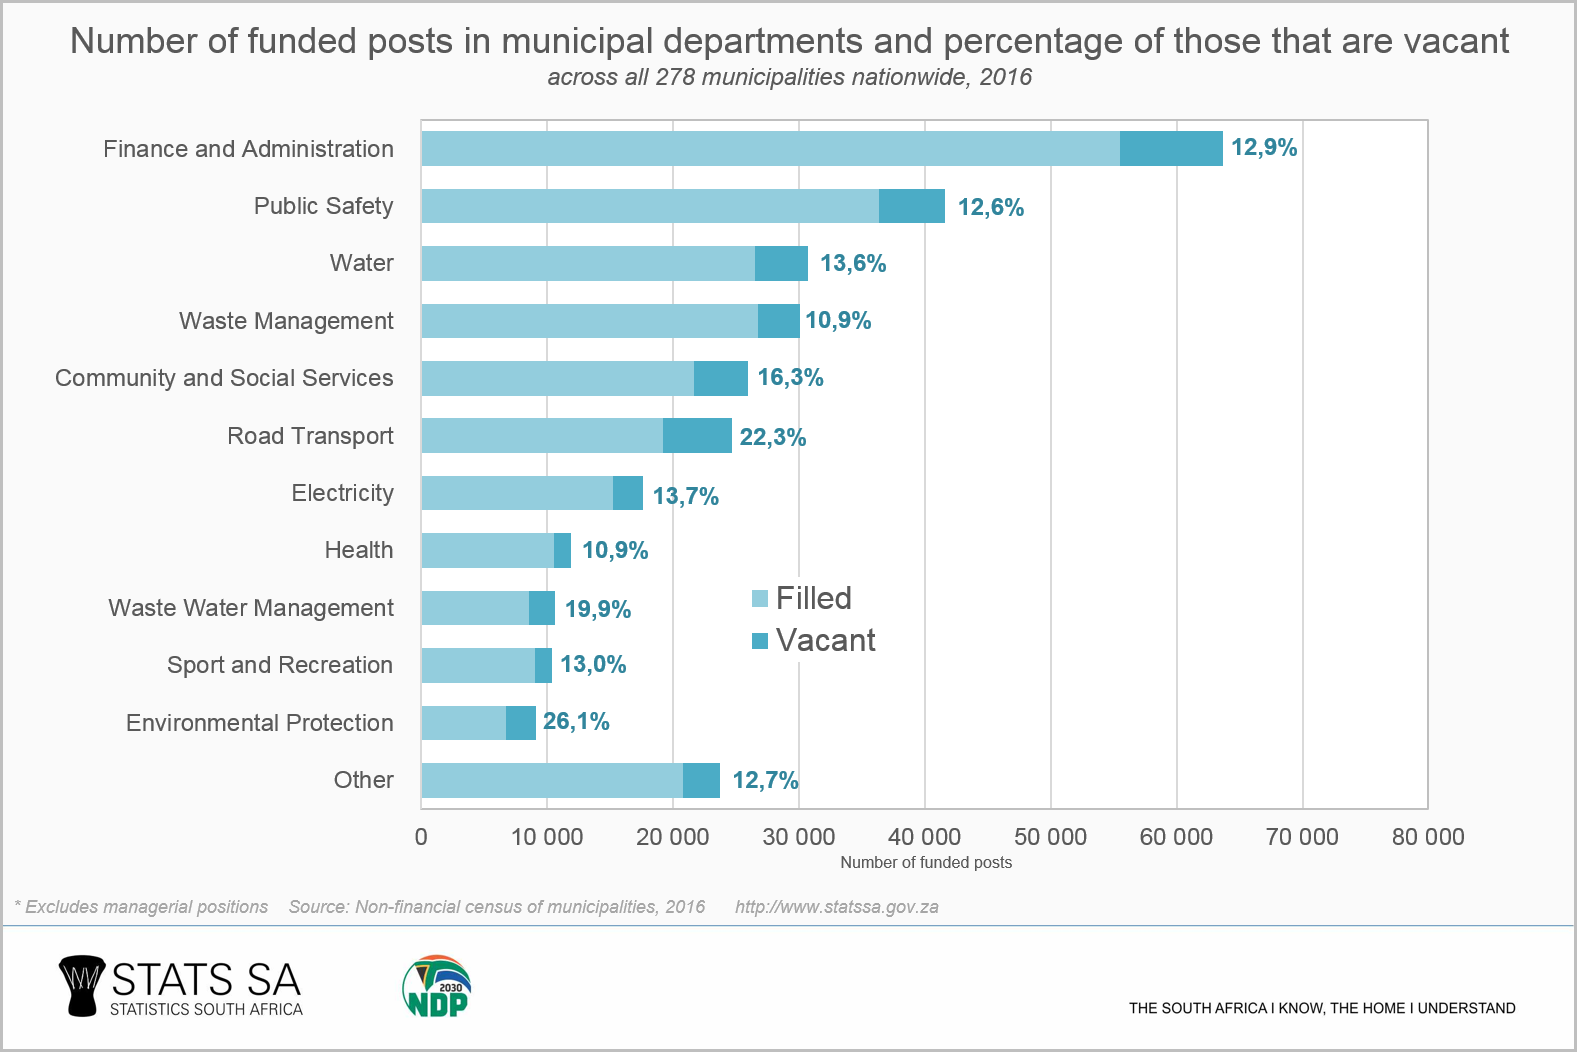
When Stats SA asked municipalities what could be the reason for staff vacancies, the following were some of the responses: (a) there was sometimes uncertainty regarding details of the personnel structure within the municipality; (b) in at least one municipality a moratorium was placed on filling of posts; and (c) many municipalities were still using outdated organograms that were due to be updated after the August 2016 local government elections.
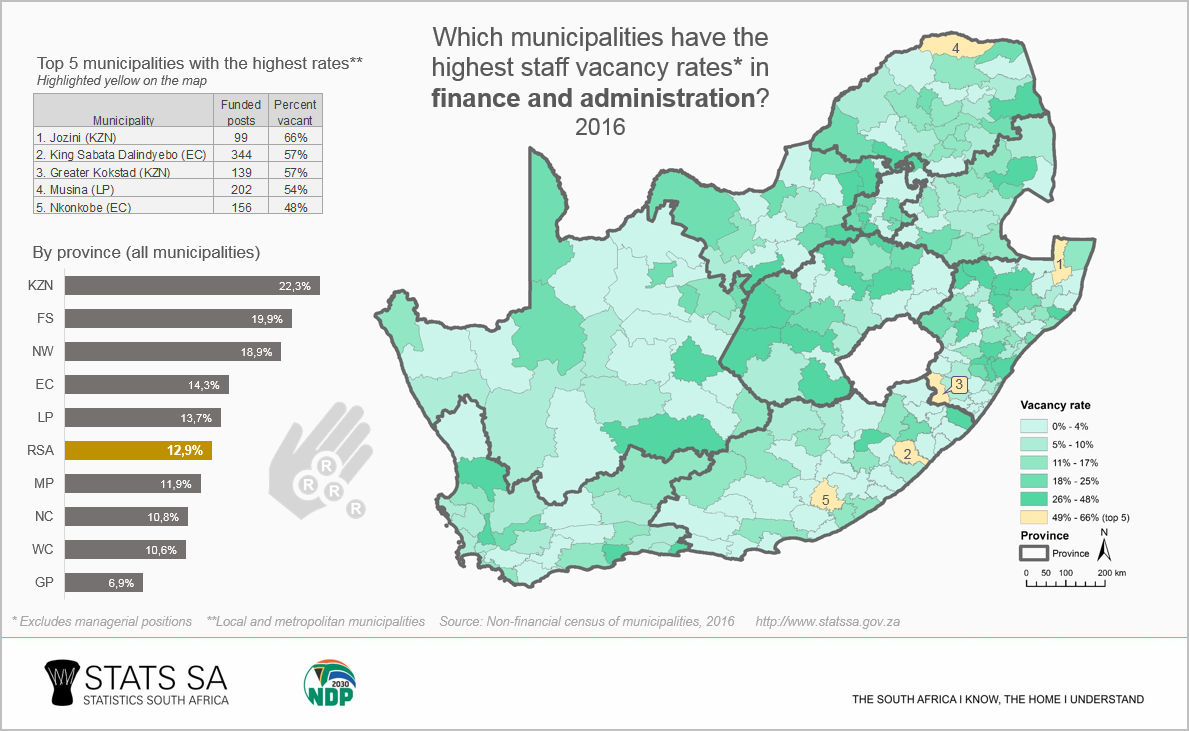
Finance and administration
Up from 11,3% in 2015 to 12,9% in 2016
Many municipalities rely too heavily on consultants to prepare their financial statements, according to the Auditor-General (AG). The AG reported that local government forked out R892 million in consultancy costs for financial reporting services in 2014/15, which was a rapid increase from the R267 million recorded in 2010/115.
Ensuring that finance departments are well-staffed is one step towards weaning local government off consultancy services. However, the vacancy rate within municipal finance departments climbed from 11,3% in 2015 to 12,9% in 2016.
Water and waste water management
Up from 13,3% in 2015 to 15,2% in 2016
Residents in Vryheid resorted to fist fights over water earlier this year6. The drought-stricken KwaZulu-Natal town was one of many that bore the brunt of one of South Africa’s worst droughts in recent history, with the municipality resorting to bringing in tankers of water for residents’ usage.
Chronic water shortages remain a concern in many parts of the country, despite relatively good rains over the last few months. Together with the drought, loss of water due to leaking pipes and the poor maintenance of water treatment plants remain constant bug-bears of South Africa’s water infrastructure network7.
The municipal departments responsible for waste water management and water reported a combined vacancy rate of 15,2% in 2016, with Rustenburg municipality way on top at 69%.
AbaQulusi municipality, in which Vryheid is located, had 187 water related posts on its books in 2016, 57 (or 30,5%) of which were vacant.
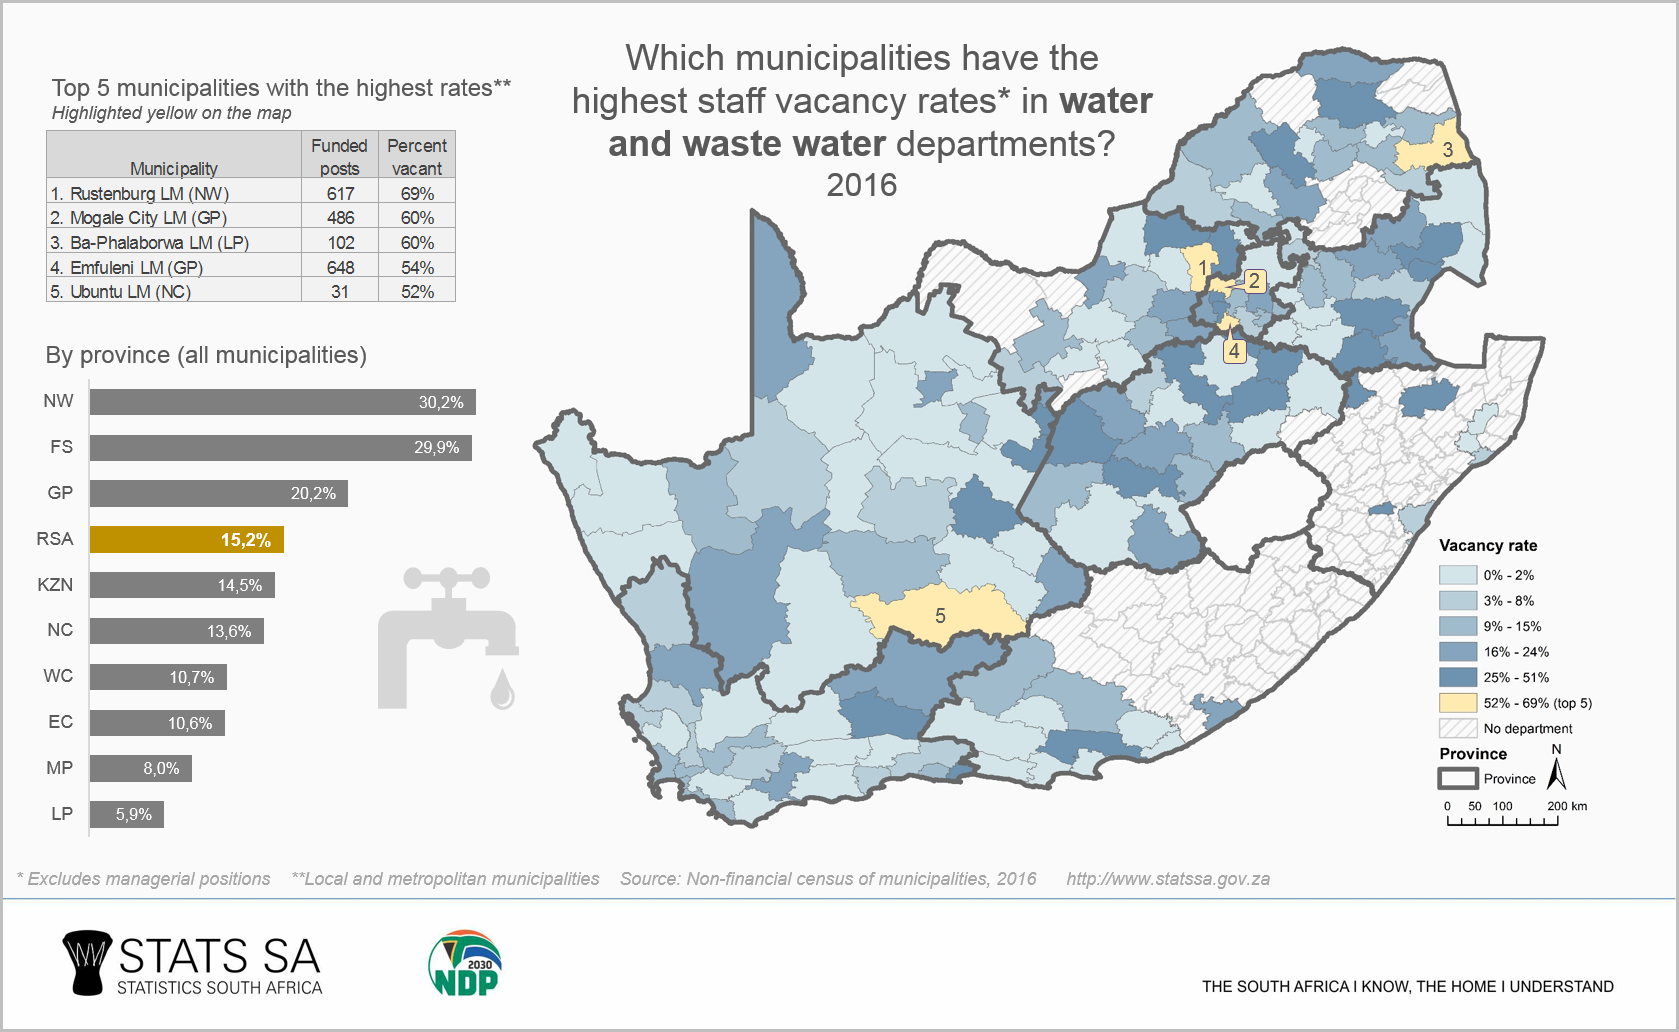
You might be wondering about those local municipalities in the map above that do not have water-related departments. The responsibility for providing water in these areas, mainly in KwaZulu-Natal and Eastern Cape, is not carried out by local municipalities but by other organisations, such as water boards or district municipalities.
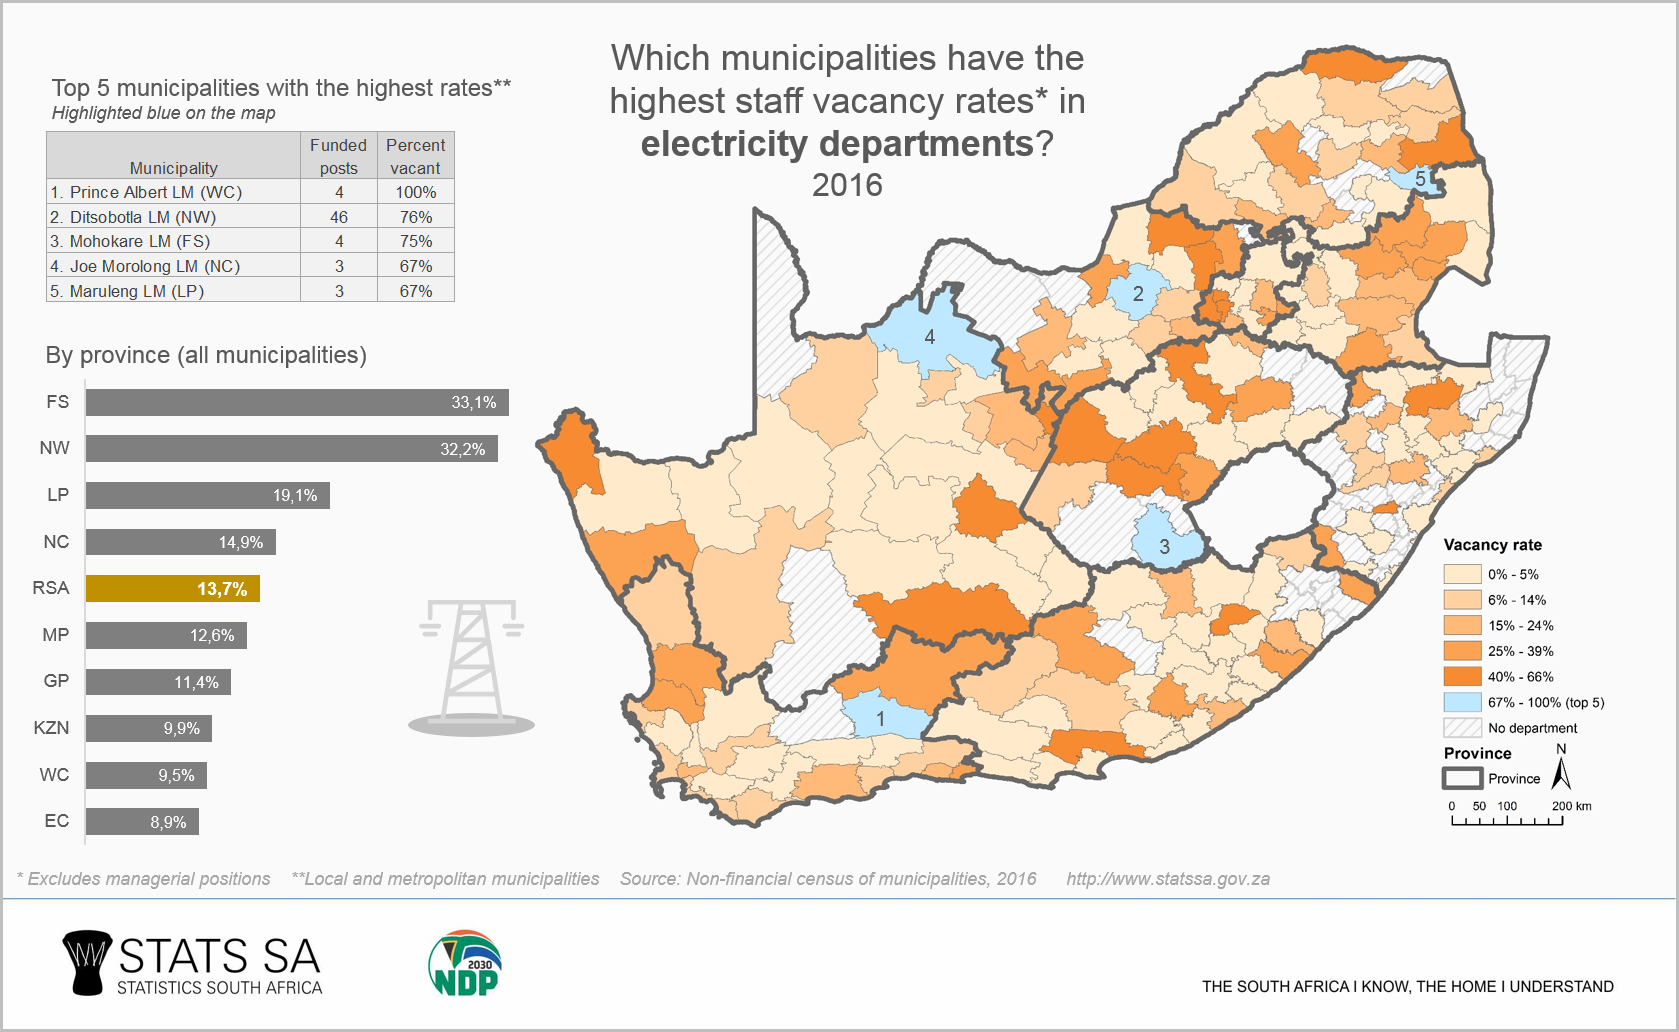
Electricity
Down from 20,2% in 2015 to 13,7% in 2016
Rolling power blackouts plagued South Africa in 2008 when demand for electricity outstripped supply. The country has since clawed itself back into a position of stable electricity generation.
The good news is that municipalities have done their part too, increasing staff capacity in their electricity departments. However, despite the fall in the national vacancy rate, empty seats remain a problem for municipalities in North West and Free State in particular.
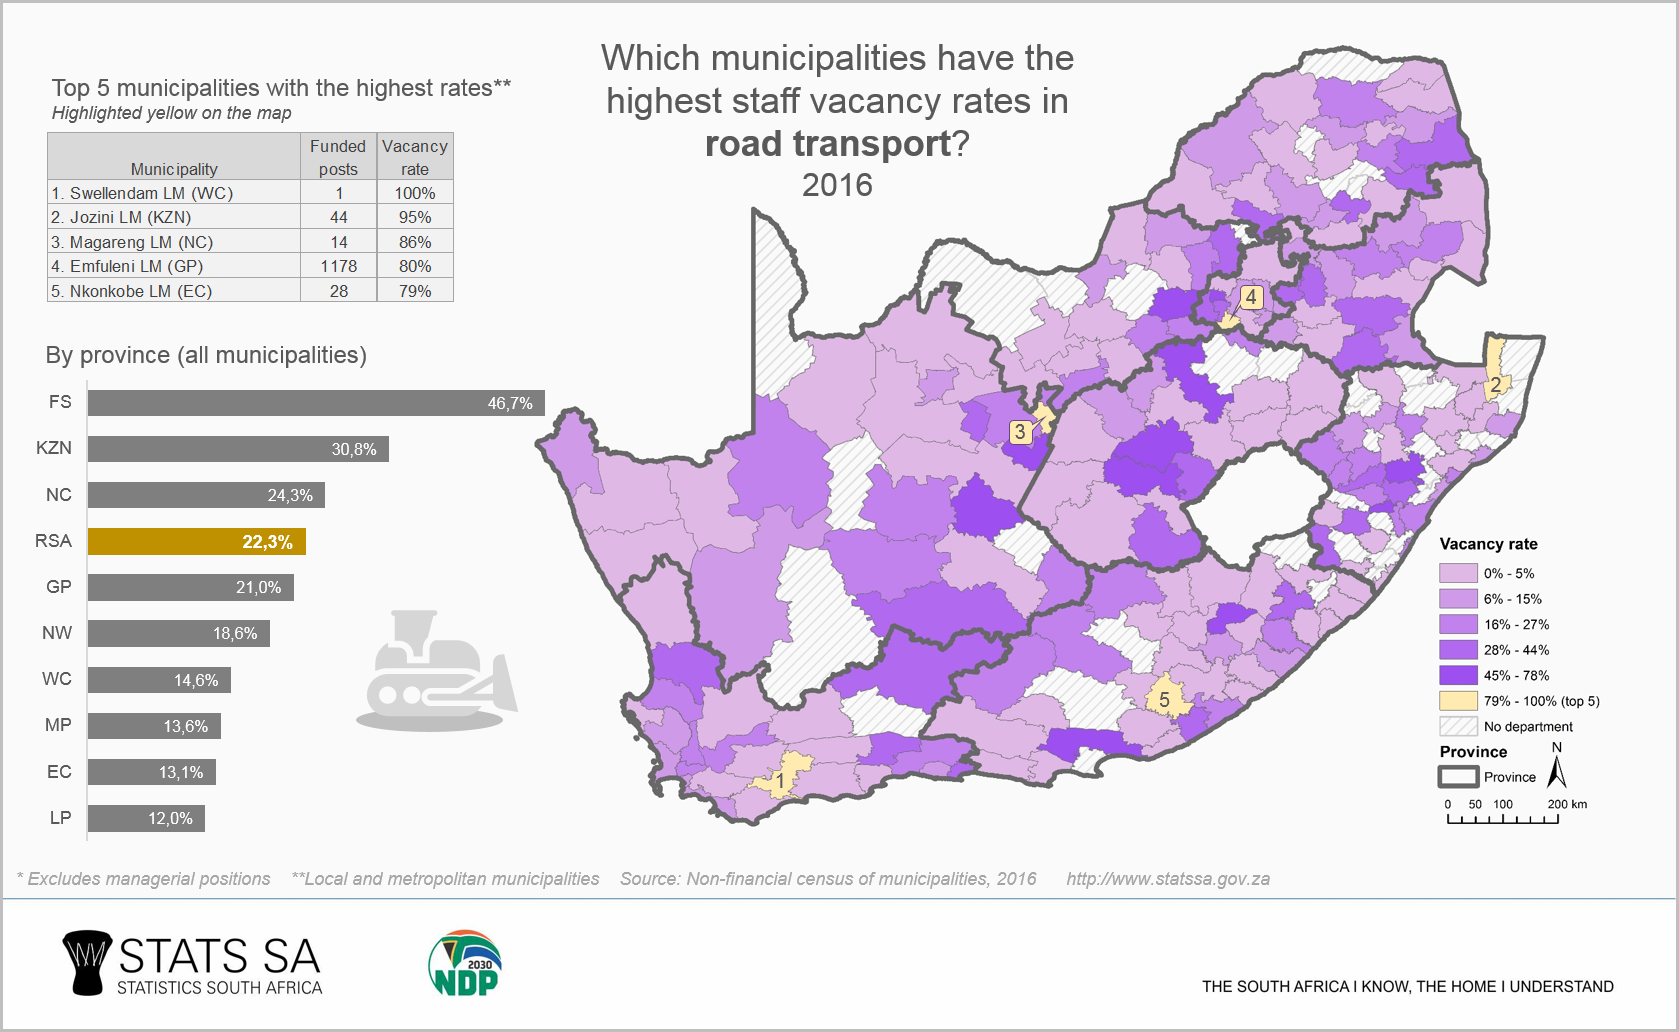
Road transport
Up from 17,7% in 2015 to 22,3% in 2016
Rabelani Dagada, Johannesburg’s Finance MMC, recently announced that R1,5 billion would be spent during the 2017/18 financial year on maintenance of road infrastructure. R105 million in particular would be spent on repairing broken traffic lights within the city8.
Does Johannesburg have the human resources to transform this money into tangible results? Of the 2 508 posts available for road transport in the city, only 131 were unfilled. With 5% of posts vacant in that department, the city is in a better position to ensure that its roads are well maintained.
Other municipalities are not so lucky. Of the 24 655 road transport posts funded nationally in 2016, 5 487 (22,3%) were vacant. Almost half of available posts in road infrastructure departments were unfilled in Free State, with high vacancy rates recorded for Mangaung (74%) and Masilonyana (69%).
To wrap up: where should we focus our efforts then?
Staff vacancies within South Africa’s local municipalities increased between 2015 and 2016, with high vacancies recorded by Free State municipalities. Emfuleni (which includes Vereeniging), Msunduzi (which includes Pietermaritzburg) and Rustenburg were the municipalities with the highest vacancy rates overall. Municipal departments that were struggling the most to fill posts included environmental protection, road transport and water waste management departments.
1 The national data used in this article were sourced from Table 2.1 and Table 2.2 in the Non-financial Census of Municipalities report, available for download here. Provincial and municipal data are available in Table 2.1 and Table 2.2 in an Excel file available on the same page.
2 The maps display local and metropolitan municipalities while data for district municipalities are included in the provincial graphs. Note that the data were collected before the local government elections of August 2016 and thus represent the earlier local government structure consisting of 278 municipalities.
3 Vacancy rate, for the purposes of the NFCM, is the percentage of funded posts that are currently unfilled.
4 All departmental figures exclude managerial posts.
5 AG Report. Section 5.3. Download the document here. View the media release here.
7 http://www.infrastructurene.ws/2016/05/10/sas-waste-water-treatment-works-in-bad-shape/
8 http://ewn.co.za/2017/05/24/joburg-finance-mmc-prioritises-development-of-road-network