
Seasonal adjustment: a short primer
Stats SA has, for the first time, included seasonally adjusted data in its Quarterly financial statistics of municipalities. What is seasonal adjustment? Why is it significant? Stats SA breaks it down for you.
South Africa’s 257 municipalities play a vital role. Not only do they interact with citizens at a local level, but they are also primarily responsible for ensuring that millions of homes across the country have access to basic services, such as water and electricity.
It would be wise then to keep a close eye on how well local government is functioning. One of Stats SA’s roles is to do just this, regularly publishing indicators on municipal services (in the annual Non-financial census of municipalities report) and municipal finances (in the Quarterly financial statistics of municipalities and the annual Financial census of municipalities reports).
The major advantage of the Quarterly financial statistics of municipalities report is that it is published four times a year, providing a detailed time series of municipal financial indicators.
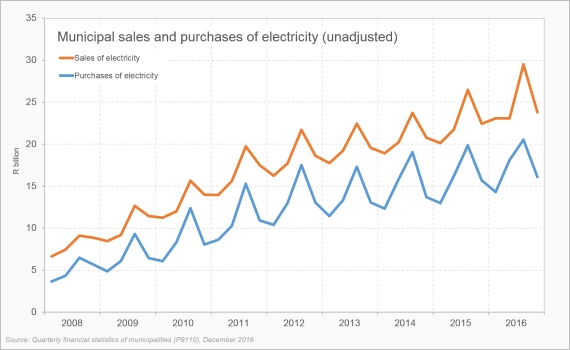
Consider the graph below, taken from the report, that plots the value of electricity bought and sold by municipalities over time1. Municipalities act as middle-men, buying electricity from Eskom in bulk and then re-selling it to residential, business and industrial customers.
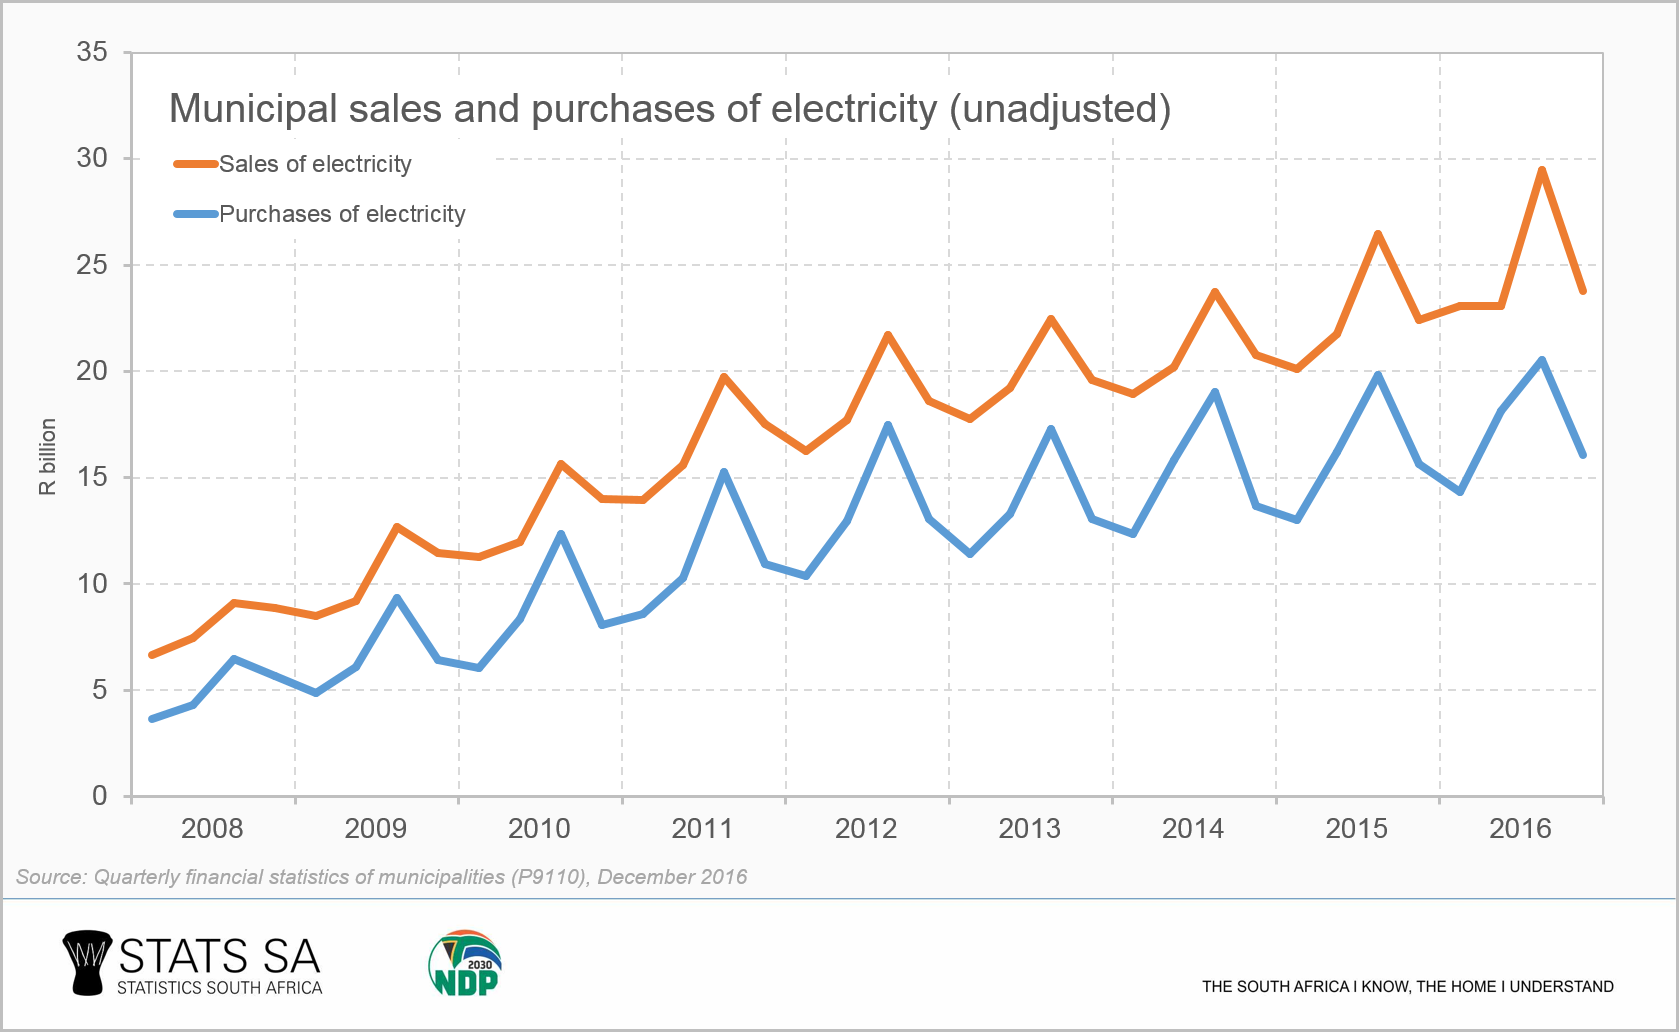
Notice how both lines peak regularly in the September quarter every year. This is a result of increased electricity usage during the winter months of July and August. In the realm of statistics, these regular peaks are referred to as a seasonal pattern.
Seasonal patterns occur in a wide variety of time series data. Think of Christmas. The festive season affects a host of data series, as covered in this article.
The problem, however, with seasonal fluctuations is that they tend to overwhelm important non-seasonal changes, making it difficult for the analyst to interpret underlying trends.
The solution is to subject the data to a process of seasonal adjustment, which removes the effect of these patterns. Stats SA has made use of X-12-ARIMA, a seasonal adjustment program developed at the United States Bureau of Census, to remove seasonality from a number of its time series. Both seasonally adjusted and unadjusted data are published for retail trade sales, motor trade sales, wholesale trade sales, mining production and gross domestic product (GDP).
You can see the impact of seasonal adjustment in the graph below, which is effectively the graph above but with seasonality removed2.
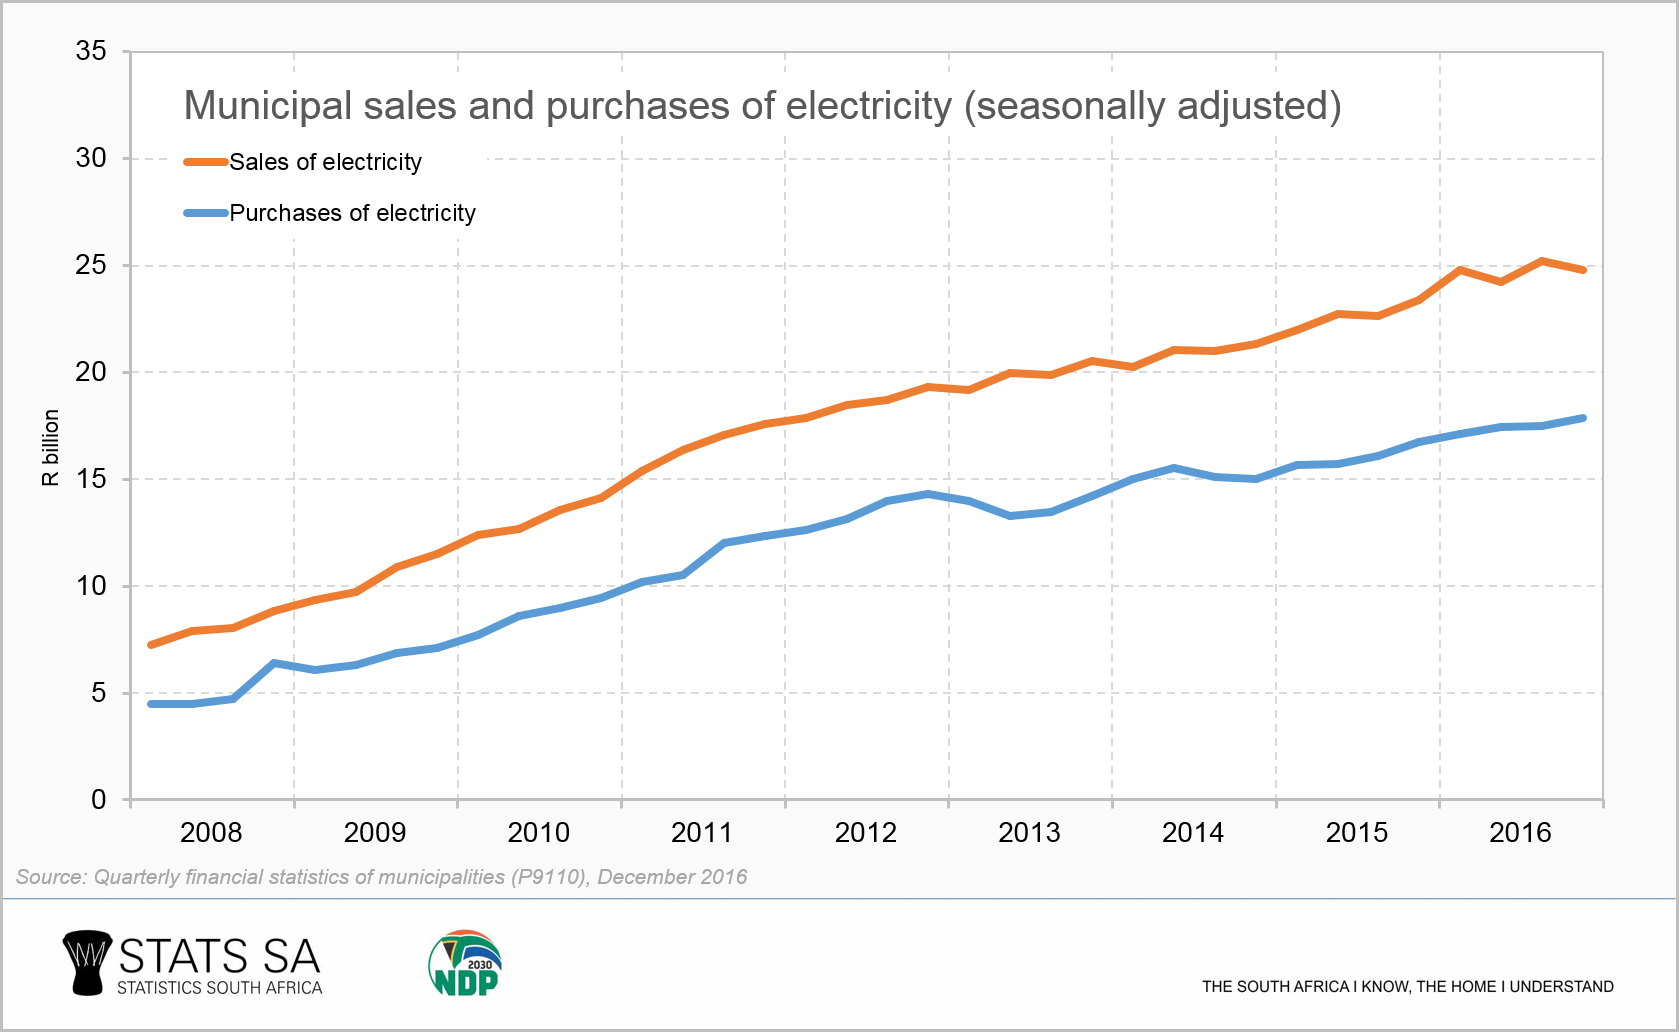
With the September peaks no longer obscuring the data, the underlining trend is more discernible; for example, the dip in purchases of electricity in the March and June quarters of 2013.
The ‘raw’ data that statisticians collect from surveys and administrative sources are often difficult to interpret. Various methods are used to present economic data in a more meaningful way, such as totals, averages, growth rates, indexing and conversion to constant prices. Seasonal adjustment may sound intimidating, but it is just one of several techniques to assist with the better understanding economic trends.
1 Download the Quarterly financial statistics of municipalities report for the December 2016 quarter here.
2 For those of you who want to dig a little deeper into the methodology, a detailed methodological note on the application of seasonal adjustment to the Quarterly financial statistics of municipalities report can be downloaded here.