Four facts about our rivers you probably didn’t know
In honour of World Wetlands Day on 2 February, Statistics South Africa (Stats SA) revisits a set of indicators on river health in South Africa to remind all of us how important our water resources are.
Here are four interesting facts from the National River Ecosystem Accounts for South Africa, published in October 2015 by the South African National Biodiversity Institute (SANBI), in partnership with Stats SA, the Council for Scientific and Industrial Research (CSIR), the Department of Water and Sanitation (DWS) and other partners1.
Fact 1: Placed end-to-end, South Africa’s rivers would encircle the earth 4 times
That’s a total length of 163 533 km, calculated from the river network data layer maintained by the DWS. Main rivers make up 47% of this total length while tributaries (smaller rivers) constitute the remaining 53%.
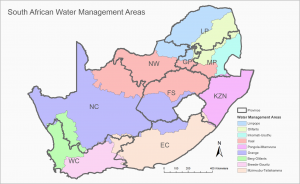
The density of South Africa’s river network, as well as the volume of water carried, increases as we move across the country from the arid west to the wetter east. Nine Water Management Areas were established to allow the effective management of rivers and water resources that differ across the country.
Fact 2: 89% of our rivers are foothill streams
A striking difference between South African and European rivers is traffic. Many European rivers are major shipping routes, used to ferry both freight and passengers throughout the region.
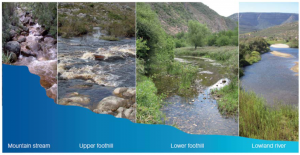
The South African river network, on the other hand, is not suited to accommodate large-scale transport. An important factor to consider is that lowland rivers – large, meandering waterways – make up only 9% of South Africa’s total river length. The remaining 91% consists of mountain streams (4%), upper foothill streams (45%) and lower foothill streams (41%)2.
Not only are large rivers useful for transport, but they are also a rich agriculture resource prone to overuse. With only 9 km of every 100 km of South Africa’s river network consisting of lowland rivers, care should be taken to protect this scarce resource.
Fact 3: The health of South Africa’s rivers has worsened
Our rivers were worse off in 2011 than they were in 1999, according to the Ecological Condition Index (ECI), introduced for the first time as a pilot index in this document. The index provides an indication of overall ecological health on a scale from 0 to 100, where 100 is the reference condition prior to human modification, and 0 is where natural ecosystem function has become totally lost.
The DWS conducted a large assessment of the condition of rivers in 1999, with a follow-up assessment in 2011. Data from these two surveys resulted in a host of indicators on various aspects such as river flow, river bank habitat and water quality. The ECI is an attempt to aggregate all these indicators into a single figure.
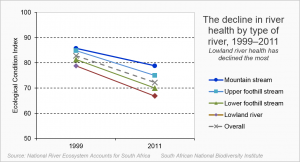
River health declined overall, with the ECI falling from 83 in 1999 to 72 in 2011. The graph below shows that lowland rivers have borne the brunt of the decline, exhibiting the largest drop in the ecological index compared with other river types.
Fact 4: Limpopo experienced the largest fall in river health
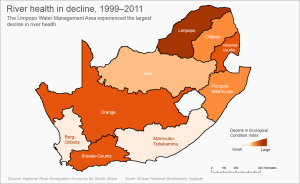
All of South Africa’s nine Water Management Areas experienced a drop in river health between 1999 and 2011, as shown in the map below.
The Limpopo Water Management area experienced the most dramatic fall, with its ECI dropping by 21 points, from 83 in 1999 to 62 in 2011. The document suggests that increased pressure from mining activities and agriculture in that region, as well as poor waste water management, contributed to the decline.
The fall in river health highlights the significance of what is referred to as the water-food-energy security nexus. The three elements of water, food and energy are intimately linked. Not only is water a vital resource for industries that drive the energy sector, such as mining, but it is also essential for the agriculture sector that produces food. Yet the expansion of agriculture and mining, which are often harmful to rivers, presents us with trade-offs that need to be carefully weighed when deciding on development priorities.
Our rivers, as well as our wetlands, are the lifeblood that drives the water-food-energy nexus. Feeding our dams with precious water, our river ecosystems carry life into our fields, homes and factories.
If we fail to look after our rivers and wetlands, they will no longer be able to look after us.
1 The National River Ecosystem Accounts for South Africa was compiled as part of South Africa’s involvement in the United Nations’ Experimental Ecosystem Accounting project, which aims to develop a new global standard for systematically tracking the health of ecosystems. South Africa is one of seven pilot countries taking part.
Download the complete discussion document here.
2 No data = 1%


