

IMPROVING LIVES THROUGH DATA ECOSYSTEMS

The new inflation basket: what’s in and what’s out
Stats SA recently announced changes to the Consumer Price Index (CPI) basket of goods and services. The changes provide interesting insight into how consumer spending patterns have shifted over the last four years.
The basket forms the basis from which the monthly CPI is calculated. There are 412 products and services in the new basket, up from 3961. Using data from the Living Conditions Survey, as well as from other sources, Stats SA identifies products and services that households spend the most money on, and these form the basket of goods.
Stats SA updates the basket of goods and services every four years, keeping within the five-year norm of international best practice, to ensure that it remains relevant. Part of the exercise involves removing products from the basket, while others are added.
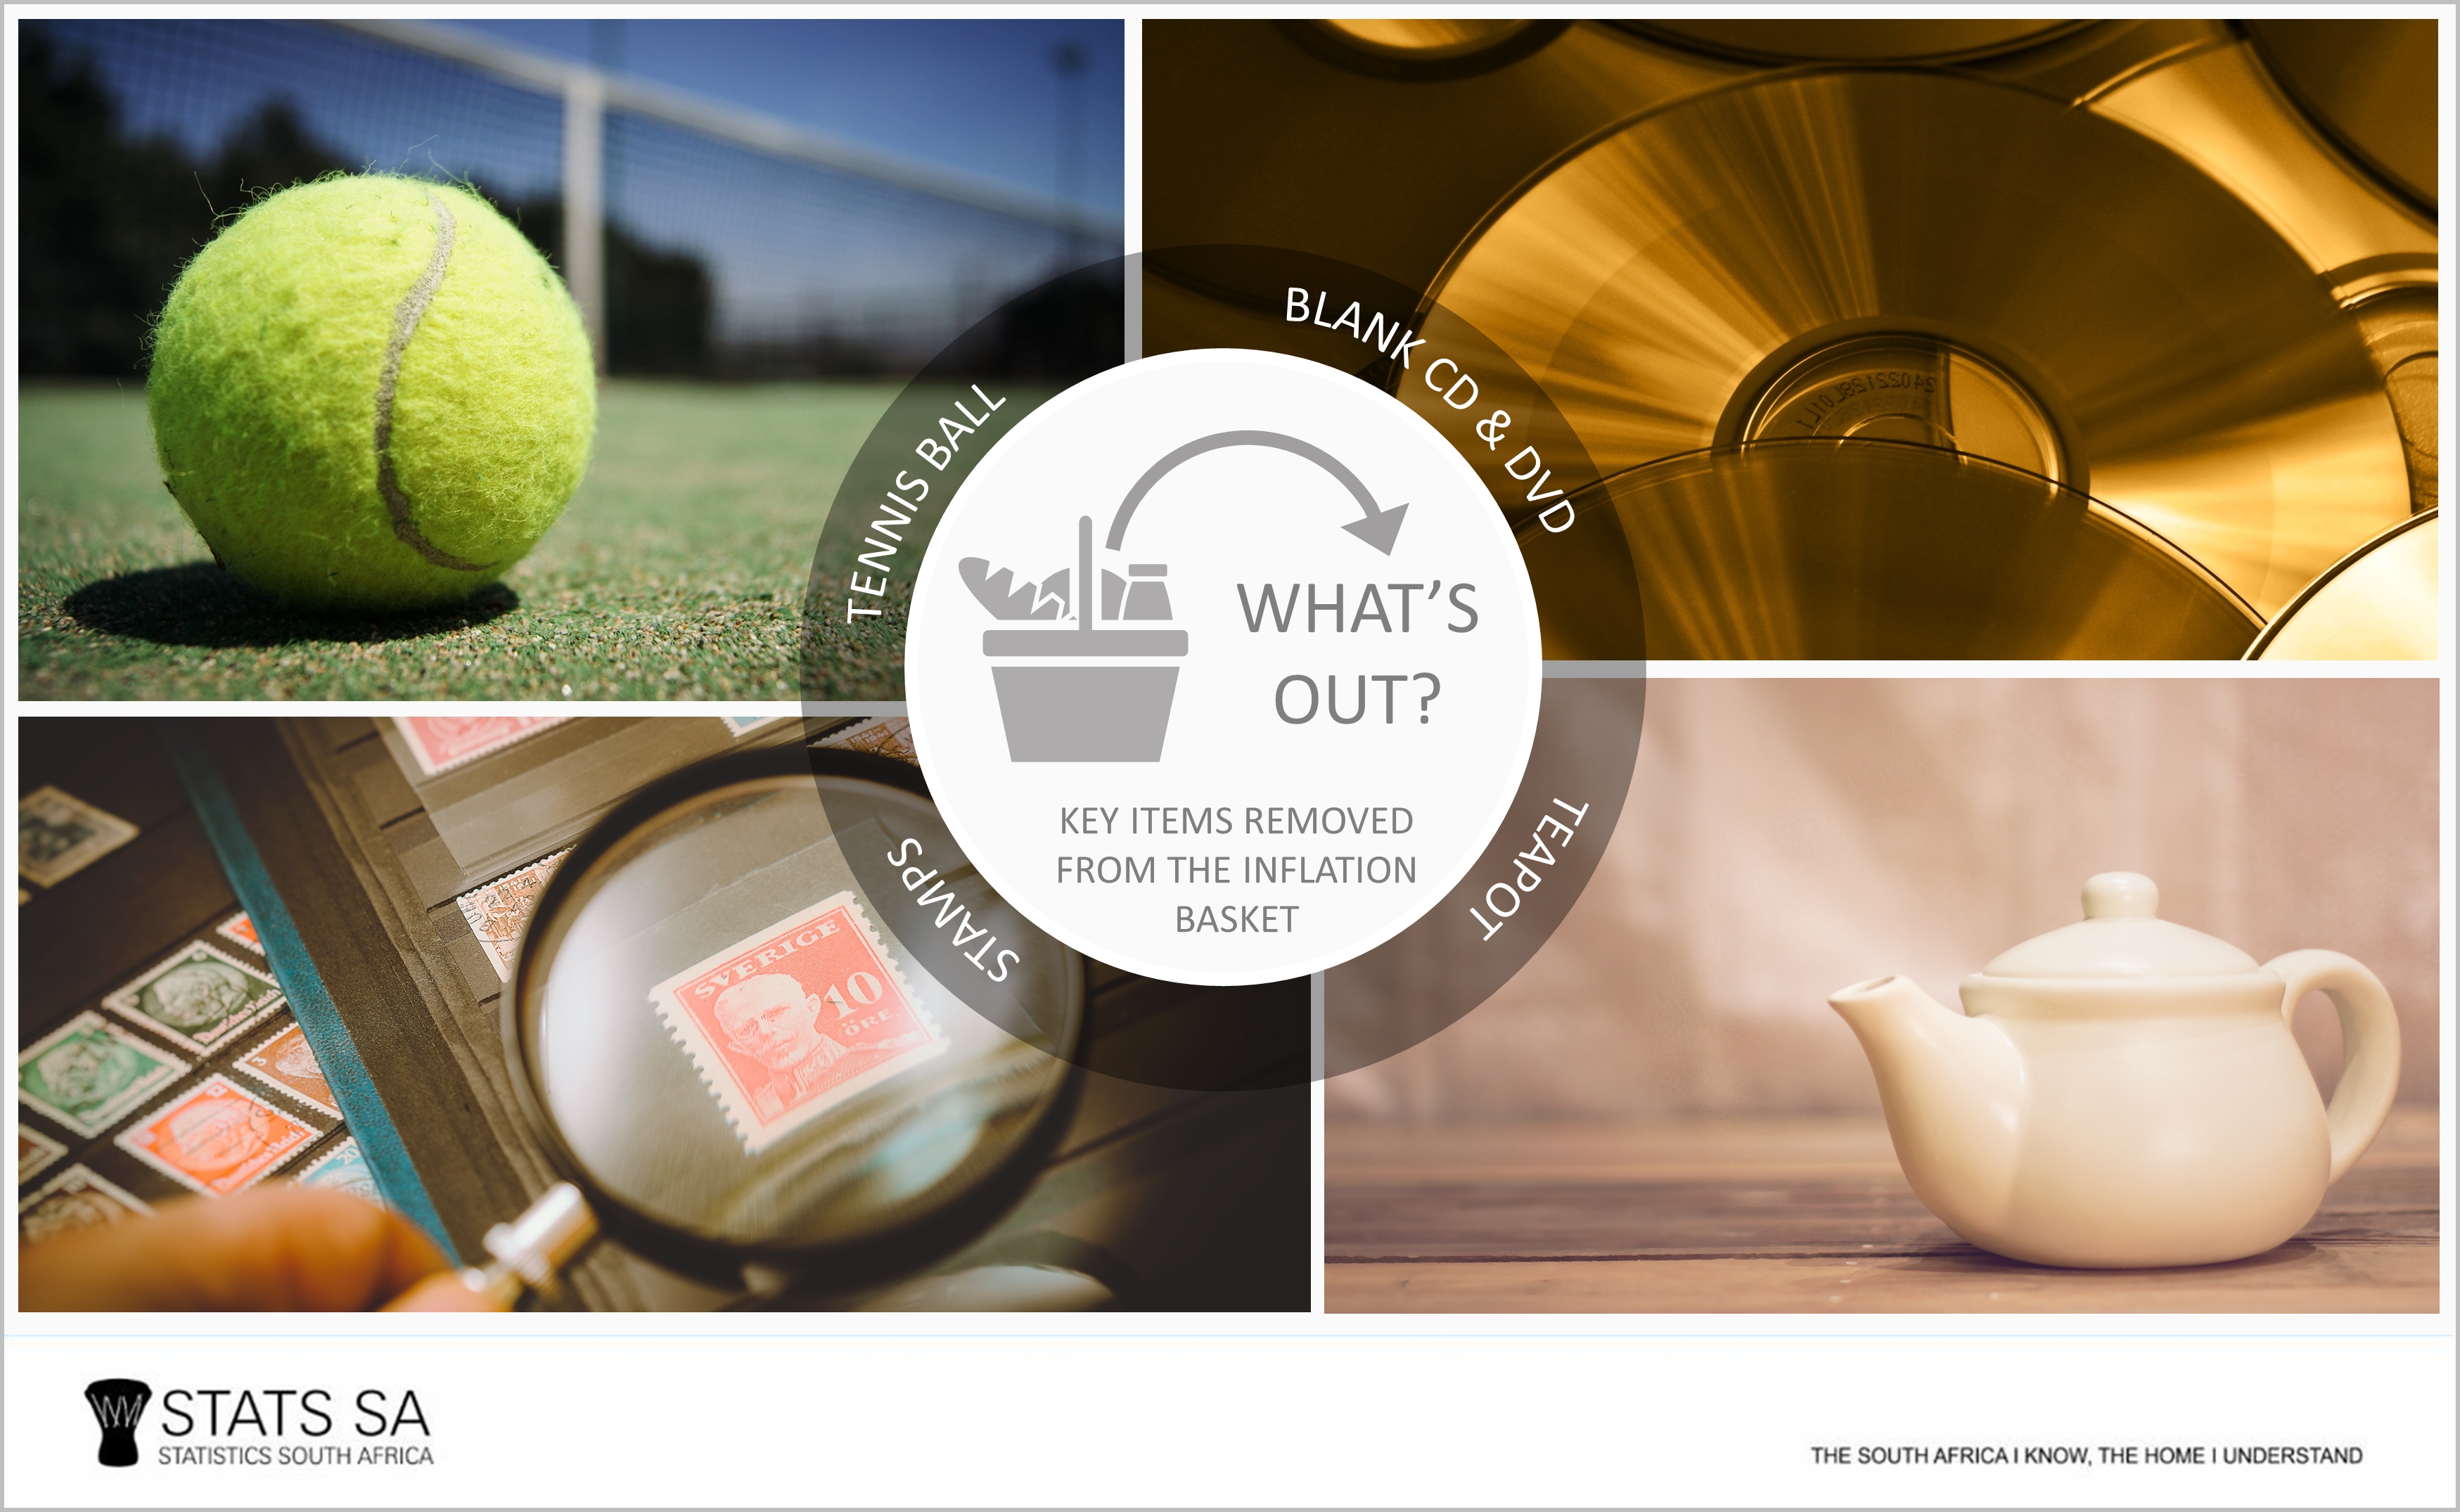
What’s out?
When last did you copy data onto a blank CD? With the rise of USB sticks and cloud storage, the days of backing up your data on a 700Mb compact disk are probably numbered. Blank CDs and blank DVDs have been removed from the basket, together with pre-recorded DVDs, reflecting shifts in the way that South Africans consume media and store data. Another victim of technological change is the removal of postage stamps from the basket.
Other items that have been removed include tennis balls, teapots, electric fans, automated pool cleaners, sweet corn (cream style), tinned peas, spreads (such as Marmite and Bovril), ward and theatre fees in public hospitals, and board games.
What’s in?
Notably, a number of convenience foods have entered the basket, such as frozen pastry products (pizza or pies), instant noodles, and ready-mix flour. Savoury biscuits and rusks also appear for the first time.
Sectional title levies have also made their debut. In Gauteng alone, the percentage of households living in cluster homes or townhouses increased from 2,0% in 2002 to 4,6% in 2015, according to the General Household Survey2.
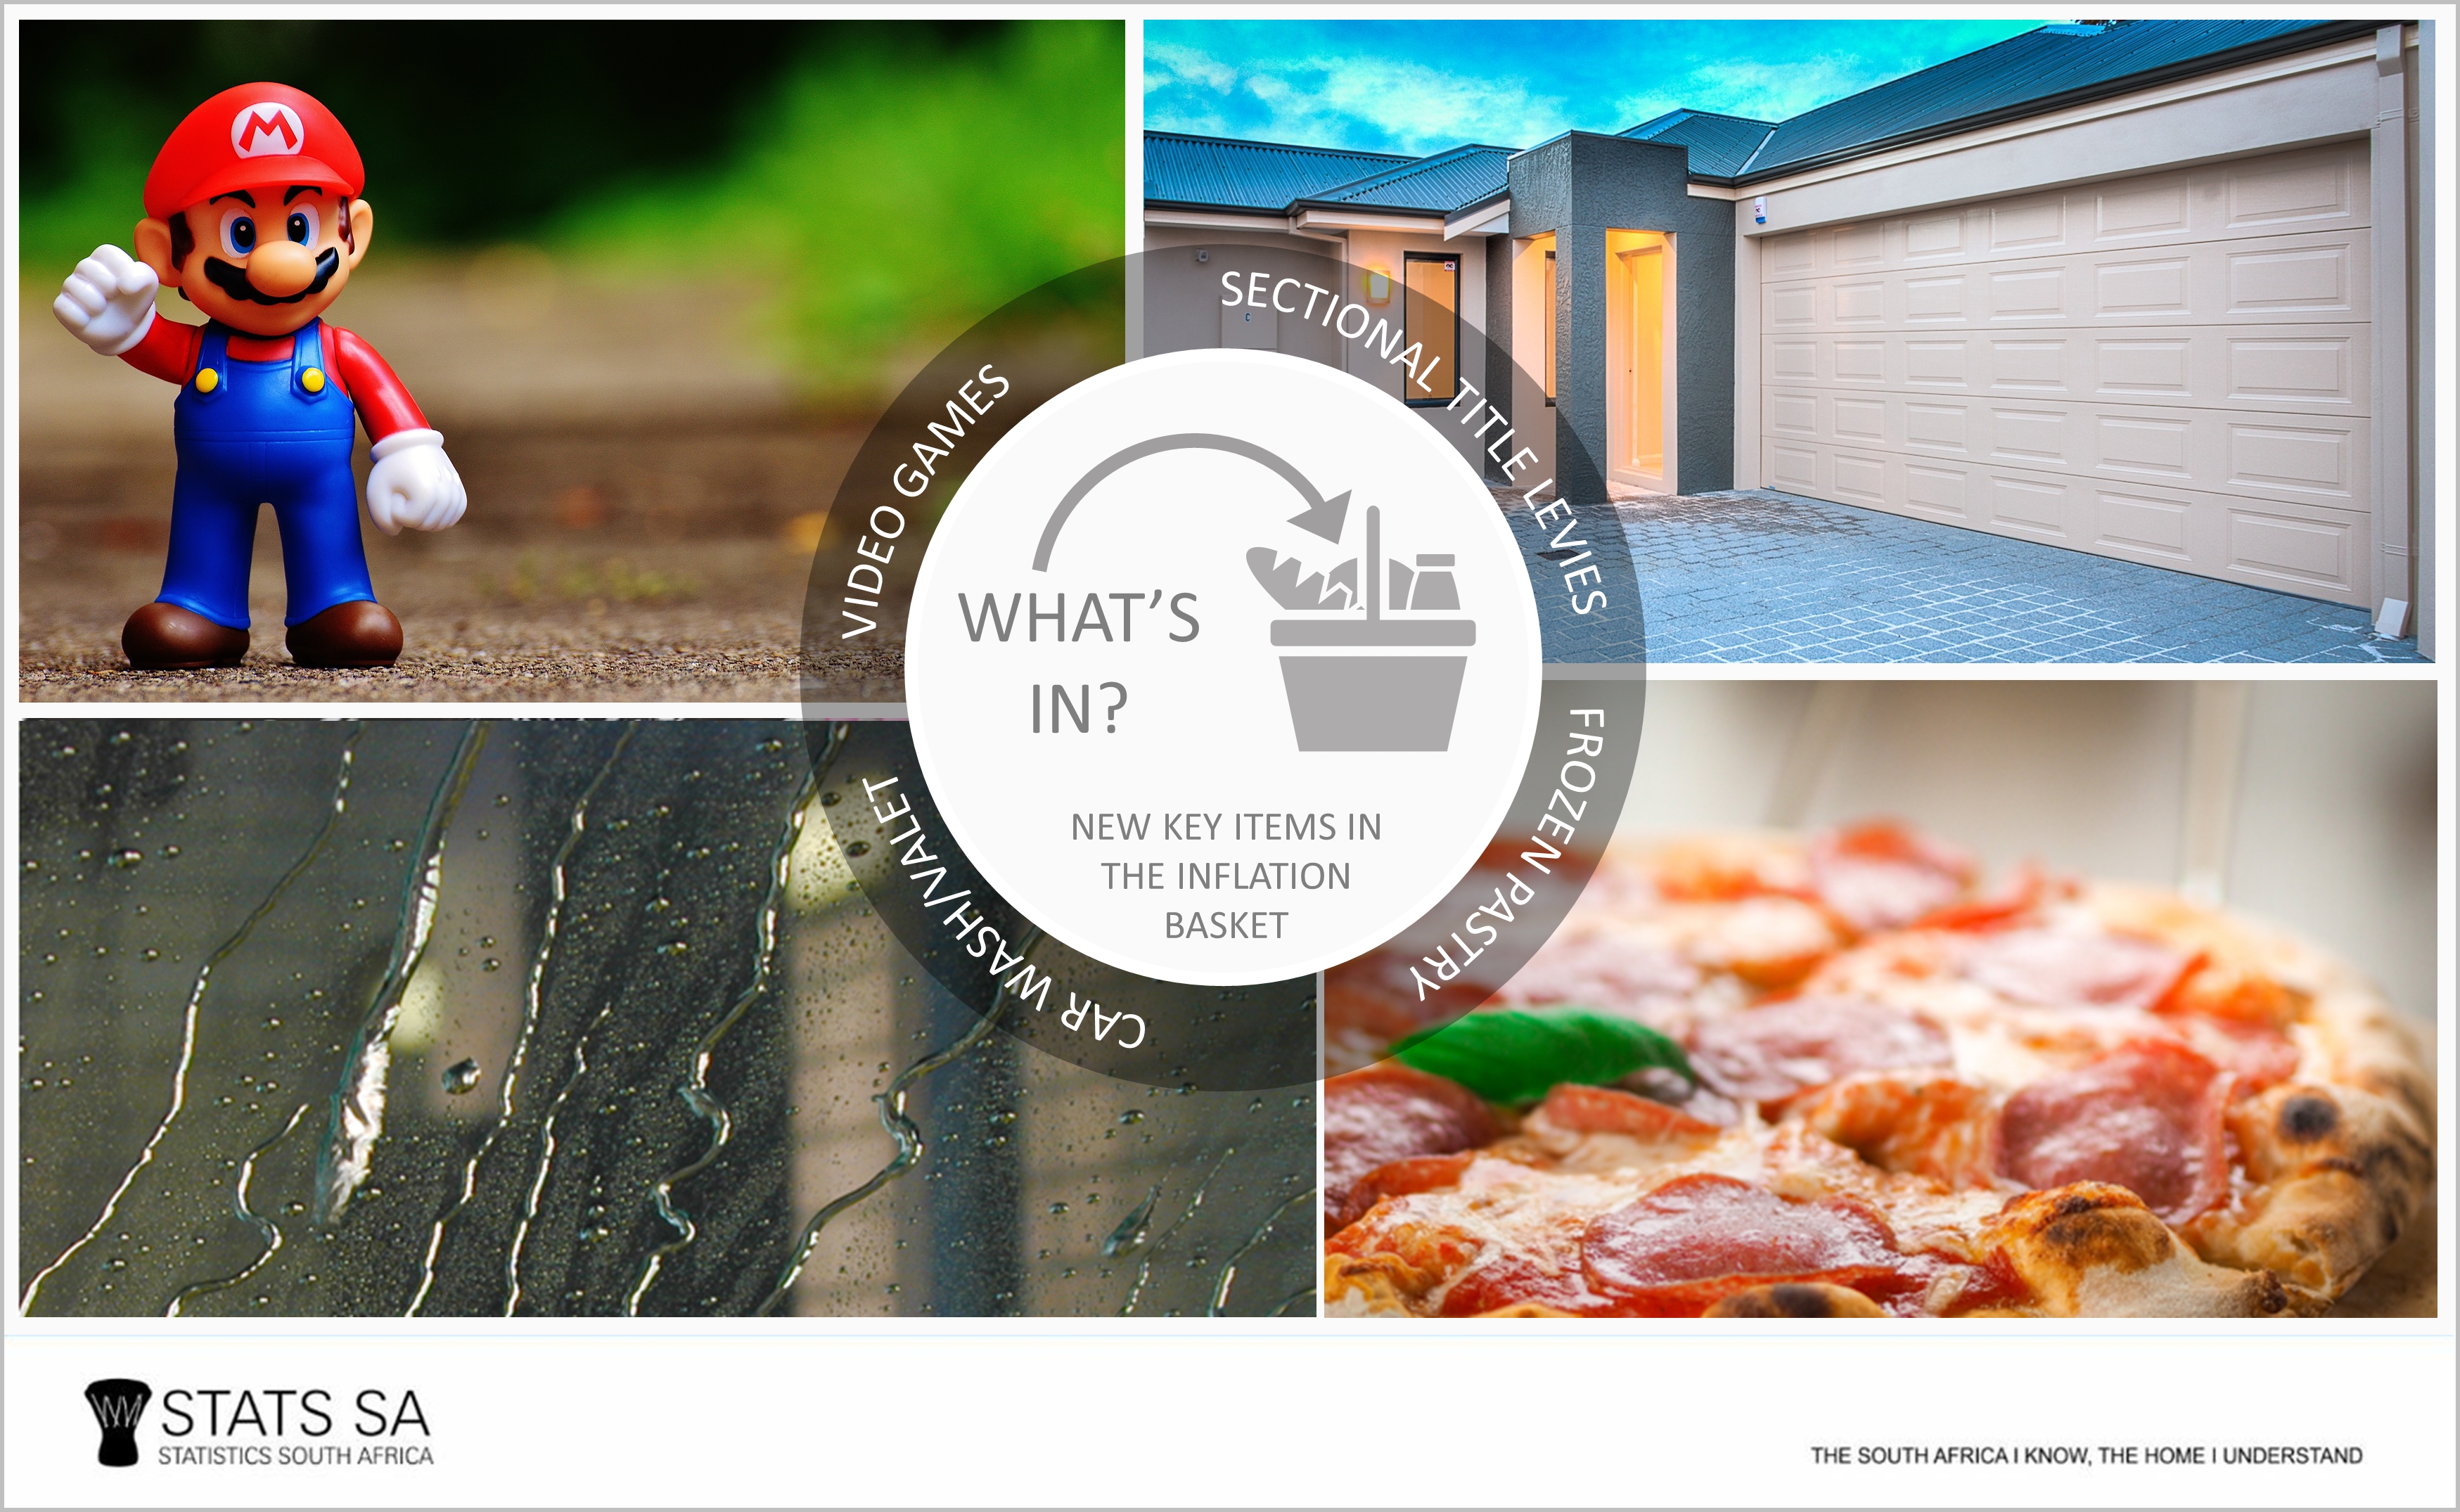
Other important items that are new in the basket include video games, car rental, car wash/valet, chicken giblets, beef offal, peanuts, pears, chewing gum, toasters, coffee mugs, toy cars, and diesel.
Digging deeper: provincial spending patterns?
The 412 goods and services in the basket are classified into 12 broad groups, such as food and non-alcoholic beverages, clothing and footwear, health, transport, and education. The interactive map below shows the percentage of total expenditure within each province that is devoted to each of the 12 categories. For example, if you click pause and select “Housing, water, electricity, gas and other fuels”, notice how 25,8% of total household expenditure in Gauteng flows into housing and services.
Map developed in amCharts (https://www.amcharts.com/ )
1 Download Consumer Price Index (CPI): Weights, 2016 here.
2Visit the archive page for the General Household Survey here.