The last 15 years: business income, spending and profit
Come join us as we tell a story of South African business performance over time. There are three elements to this story, taken from Stats SA’s latest Annual financial statistics (AFS) report1: income, expenditure and profit.
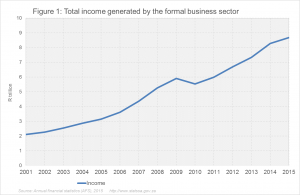
First, let’s explore income. The income generated by the formal business2 sector has increased consistently, except for the dip in 2010 as a result of the recession (Figure 1). Total income has grown by an average of 11% per year since 2001. In 2015, businesses generated R8,7 trillion.
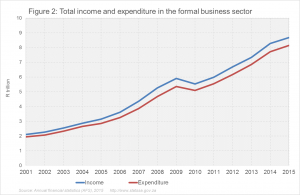
Now, let’s add total expenditure3, or total spending, to this graph. Notice how the red line (spending) is always below the blue line (income) (Figure 2). This indicates that the formal business sector has always generated more money than it has spent. In 2015, businesses incurred R8,2 trillion in expenditure. Purchases and employment costs were the largest components of expenditure in 2015.
Does this mean that the businesses are doing well? A more nuanced picture emerges if we calculate growth rates for both these lines. Spending rose by an average of 11,0% per year from 2001 to 2015, slightly higher than the 10,9% rise in income. If we calculate from 2011, spending’s growth rate was 10,1% per year, higher than the 9,8% rise in income.
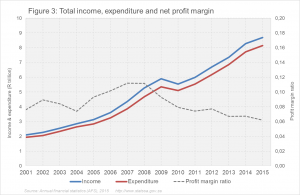
This has an impact on profit, the final element that will be added to the graph. The profit margin ratio is calculated by dividing net profit before tax and dividends (NPBT) by total income. Businesses enjoyed relatively high profit margins in the periods prior to 2009 (Figure 3). For example, for every rand of income generated in 2007, 11c was left over as profit. But this declined after the recession, falling to 6c in 2015.
So even though the South African formal business sector is generating higher amounts of income every year, costs have escalated at a slightly faster rate. As a result, profit has declined in relative terms (i.e. as a percentage of income).
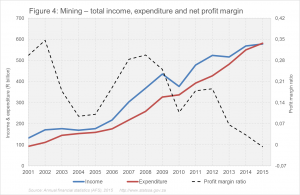
The same graph plotted for the mining industry shows a more exaggerated pattern (Figure 4). What is immediately noticeable is how quickly costs have been rising and profits decreasing. What takes a little longer to notice is the fact that mining experienced a loss in 2015, with the profit margin ratio falling below zero. The industry generated R578 billion in income but incurred R581 billion in expenditure, resulting in a net loss of R3,5 billion. This is despite the fact that the industry grew in real terms by 3,2% in 2015, according to Gross domestic product figures4.
1 The AFS survey measures the financial health and performance of each industry, including information on turnover, purchases, and capital expenditure. The report sources data from the financial statements of enterprises (i.e. private businesses and public corporations) in all industries, with the exclusion of government institutions and financial intermediation, insurance and business services not elsewhere classified. Download the release here.
2 Formal business includes private businesses and public corporations.
3 Expenditure or spending is the sum of total expenditure (excluding capital expenditure) and net movements in inventories.
4 Gross domestic product, 3rd quarter 2016. Visit the download page here.


