
The ups and downs of gross domestic product
Economic growth can be reported in a number of different ways. Annual growth, quarter-on-quarter and year-on-year are terms that are commonly used in the context of gross domestic product (GDP). What do these terms mean? In preparation for Stats SA’s next release of GDP data on 6 December, this article explores the different ways in which growth is measured.
A country’s annual gross domestic product (GDP) is the final value of all its goods and services produced during a year. It is a widely used measure of the size of a country’s economy, and the responsibility for calculating South Africa’s GDP rests with Statistics South Africa.
There are several measures of GDP growth, each describing economic performance from a slightly different angle. Commentators often only use one measure to gauge the health of the economy. However, a more complete picture emerges if all the measures are taken into account.
The following explanations and examples are quite detailed. Readers with a time constraint may prefer to skip to the summary and conclusion!
Annual GDP and economic growth
The percentage change in GDP from one year to the next gives the country’s annual rate of economic growth. South Africa’s annual GDP is shown in Figure 1 (click on the image to enlarge), and its annual growth rate is shown in Figure 2. Both graphs are based on GDP at constant 2010 prices, or in real terms, which simply means that the effect of inflation has been eliminated. Real GDP is a volume indicator of economic activity.
Figure 1
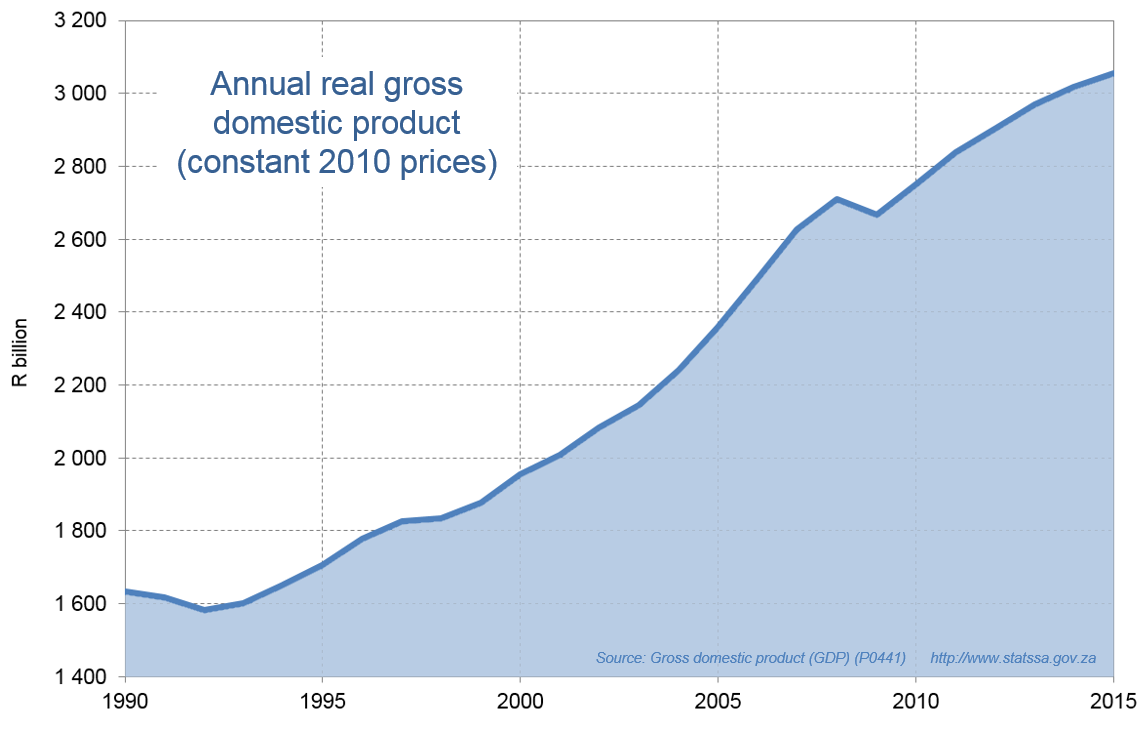
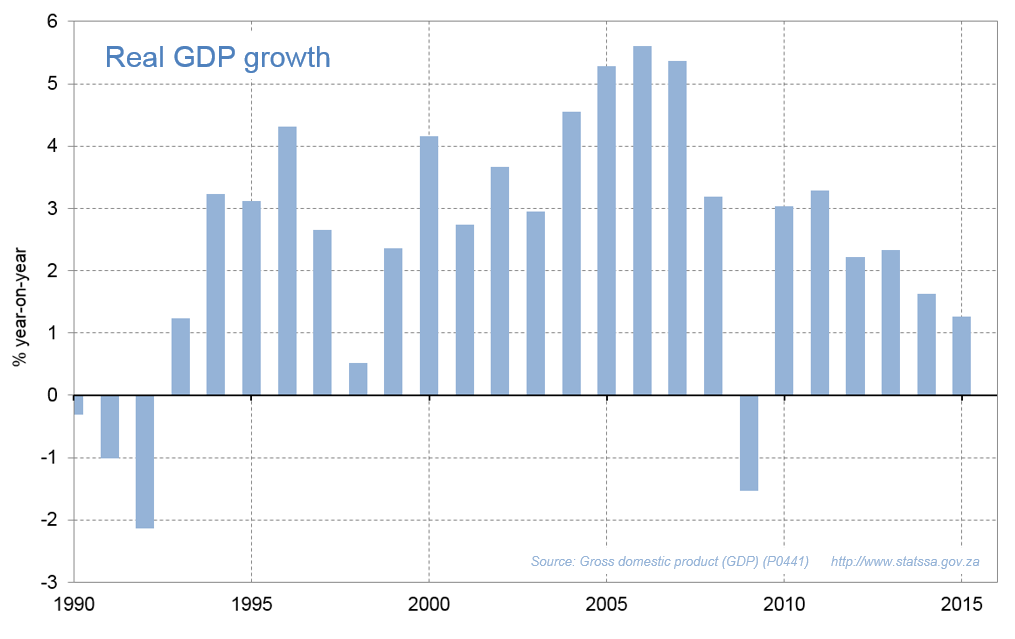
Figure 1 shows that the general trend in real GDP was upwards during 1990–2015. Less obvious from Figure 1 is the years in which GDP increased faster than others, but that is easily solved by referring to Figure 2. In Figure 2 we see that South Africa’s real GDP growth was negative in the early 1990s (the initial decline that we see in Figure 1), but then turned positive and reached over 5% per year in each of the years 2005, 2006 and 2007. The South African economy was badly affected by the global economic crisis of 2008–2009, with calendar 2009 experiencing a drop in the level of GDP (Figure 1) and therefore a negative growth rate (‑1,5%, as shown in Figure 2). A period of recovery followed, with positive growth rates during 2010–2015, but these were still well below the achievements of 2005–2007.
Figure 2
Quarterly GDP
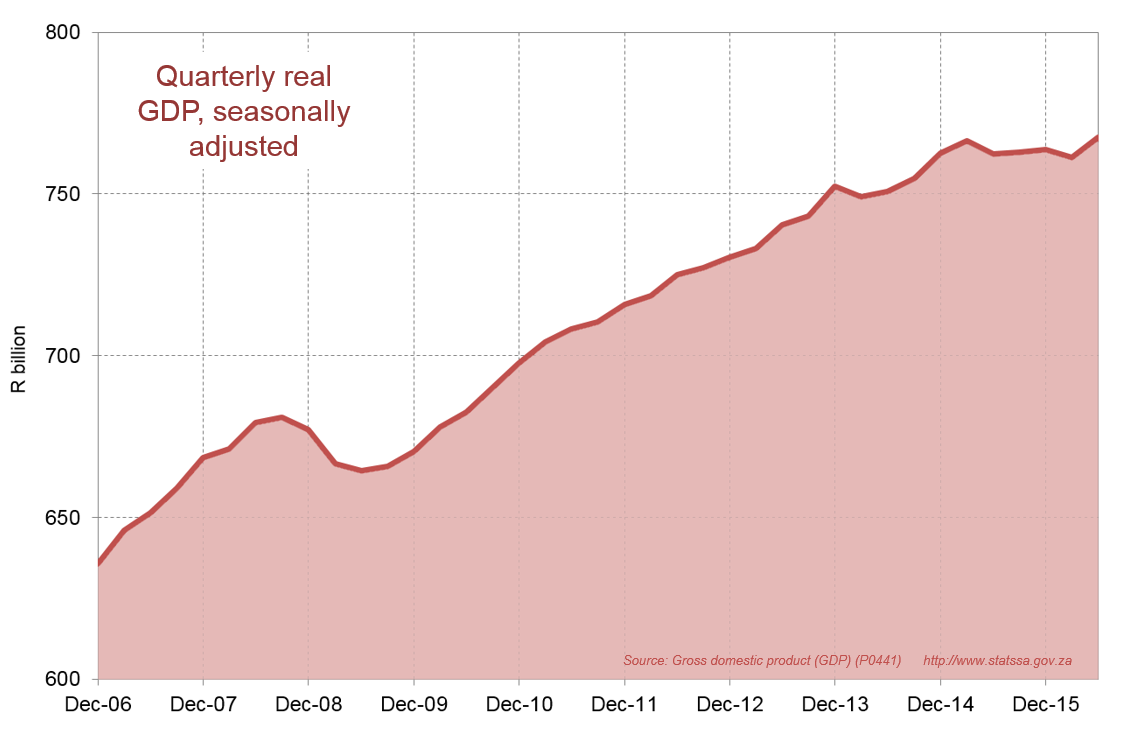
Most people who are interested in economic growth require the GDP results much more frequently than once a year. The events of 2008 and 2009 provide a striking example of the need for quarterly GDP data. Stats SA’s first estimate of GDP for the whole of 2009 was first published in the first quarter of 2010, but the downturn in GDP had started five quarters before that, namely the fourth quarter of 2008. Quarterly GDP is shown in Figure 3.
Seasonal adjustment
One complication with quarterly GDP is that it needs to be adjusted for seasonal patterns. For example, manufacturing production is usually very high in the fourth quarter (in particular October and November) in anticipation of strong festive season sales. No matter how badly the economy is doing, actual (or unadjusted) manufacturing in the fourth quarter is almost always guaranteed to be higher than the third quarter. So, to assess quarter-on-quarter performance, the seasonal effect must be estimated and taken out of the data. This is why GDP in Figure 3 is described as ‘seasonally adjusted’.
Figure 3
Quarterly growth rates
Another complication with quarterly GDP is that we now have a choice of growth rates. One option is the percentage change between the latest quarter and the same quarter one year ago, known as the year-on-year growth rate; this is usually calculated using actual (unadjusted) GDP. Another option is the percentage change from the previous quarter to the latest quarter, using seasonally adjusted GDP. This is the quarter-on-quarter growth rate, which can easily be annualised to tell us what the equivalent annual growth rate would be if the same quarter-on-quarter rate were repeated for four consecutive quarters.
Stats SA publishes both the year-on-year and the quarter-on-quarter growth rates of GDP, with the quarter-on-quarter rate being seasonally adjusted and annualised (q/q saa). These two growth rates can be quite different. For example, in the second quarter of 2016, the year-on-year rate was 0,6% whereas the q/q saa rate was 3,3%. The fact that there may be big differences between the two rates should come as no surprise, because they measure quite different things. Here again the example of 2008 is useful. In the fourth quarter of 2008 the year-on-year rate was 1,1% (GDP was 1,1% higher in Q4: 2008 compared with Q4: 2007). However, the q/q saa rate was -2,3%, telling us that the chill winds of the global economic meltdown had already hit our shores. The year-on-year growth rate was positive not because of events in Q4: 2008, but only as a result of the upward trend that was still in place during the first three quarters of 2008.
When Stats SA publishes quarterly GDP, it places the emphasis on the q/q saa growth rate. This ‘headline’ rate tells us the performance of GDP in the latest quarter compared with the previous quarter. Similarly, in reporting the growth rates of the components of GDP and their contributions to total growth, all the emphasis is on the quarter-on-quarter performance, seasonally adjusted and annualised. The headline GDP growth rate is shown in Figure 4. Note that whenever there is a dip in the line in Figure 3, it is reflected by a negative growth rate in Figure 4.
Figure 4
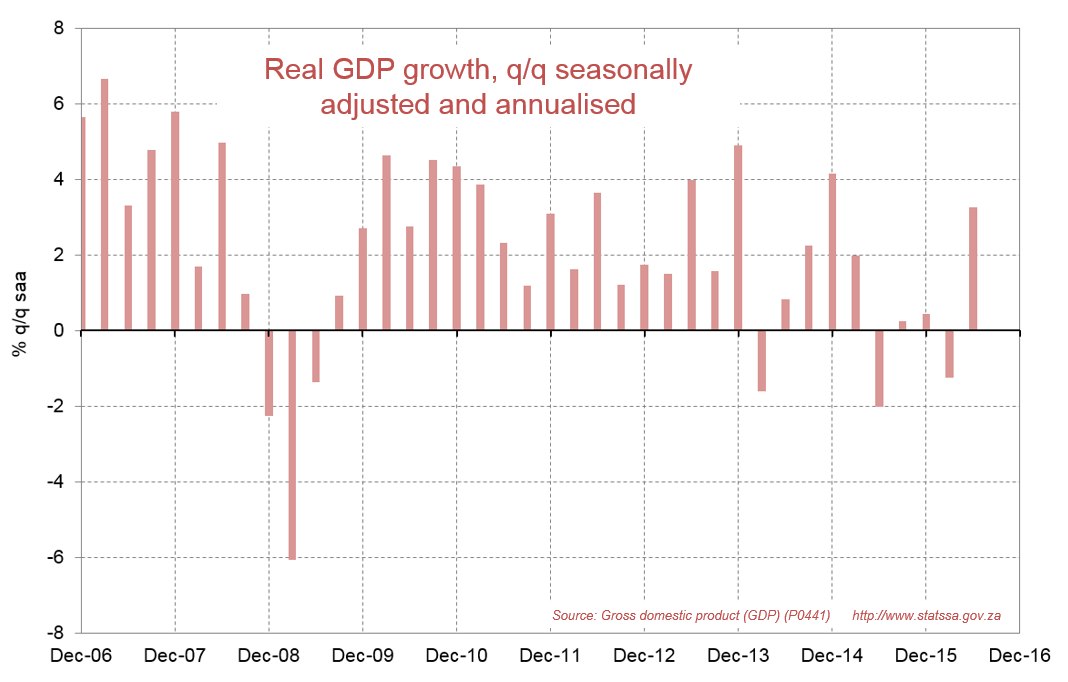
An important caveat regarding the q/q saa rate is that it can be volatile. For example, a protracted strike in one industry in one quarter could have a big negative impact on total GDP in that quarter, only to be followed by a strong positive rebound in the next quarter. In both cases the q/q saa growth rates would be magnified by a factor of approximately four (because of annualisation[1]), so it is important to interpret q/q saa rates in their correct context. For example, when Stats SA published a q/q saa GDP growth rate of 3,3% for Q2: 2016, no economists took this as an indication of GDP performance for 2016 as a whole. In Q1: 2016, the q/q saa rate was negative, namely -1,2%.
Year-to-date growth rate
Another GDP growth rate that Stats SA calculates in its second- and third-quarter GDP publications is the year-on-year growth rate for the year to date. For example, from the first six months of 2015 to the first six months of 2016, real GDP rose by 0,3%. Similarly, when Stats SA publishes Q3 GDP in December 2016 it will include the outcome for the first nine months of 2016 compared with the first nine months of 2015.
Summary and conclusion
In summary, there are four types of real GDP growth rates to understand.
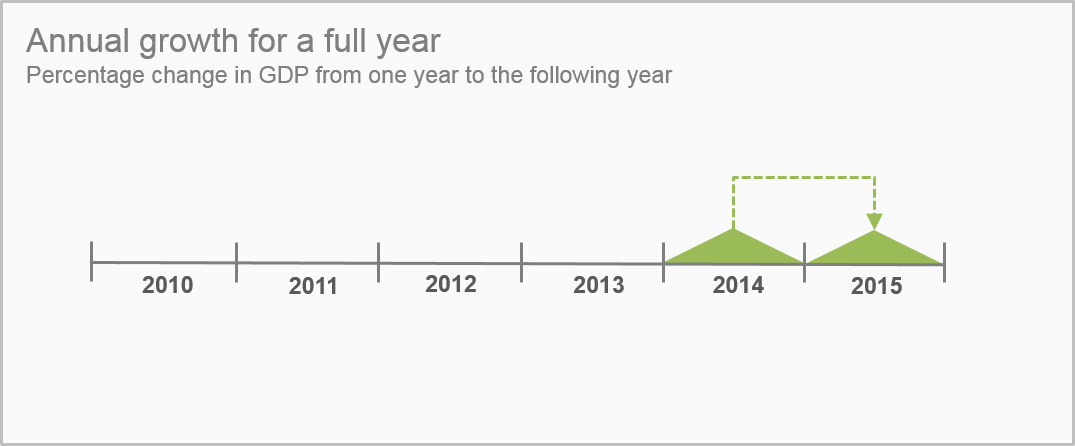
1. Annual growth for a full year
This is the percentage change in GDP from one year to the following year. For example, real GDP increased from R3 017bn in 2014 to R3 055,2bn in 2015 (see Figure 1), which was a growth rate of 1,3% (see Figure 2).
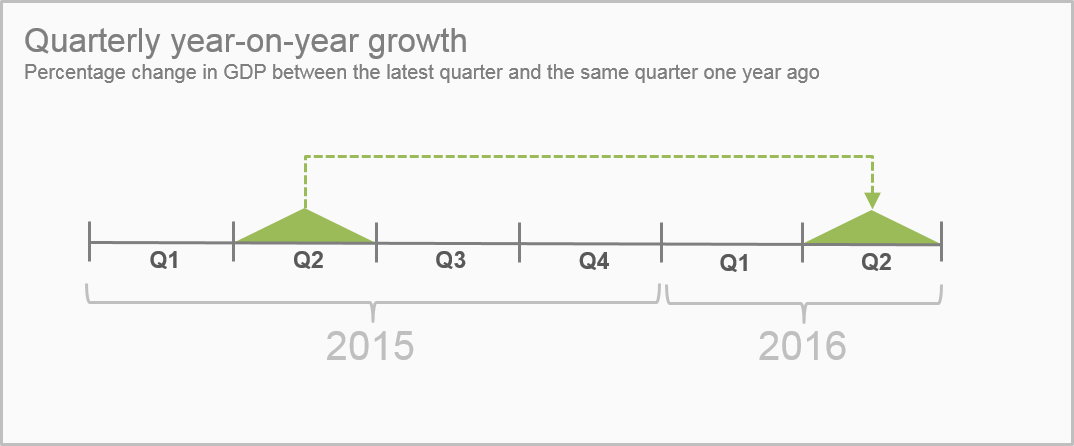
2. Quarterly year-on-year growth
This is the percentage change between the latest quarter and the same quarter one year ago. For example, real GDP increased from R762,1bn in Q2: 2015 to R766,8bn in Q2: 2016, which was a growth rate of 0,6%.
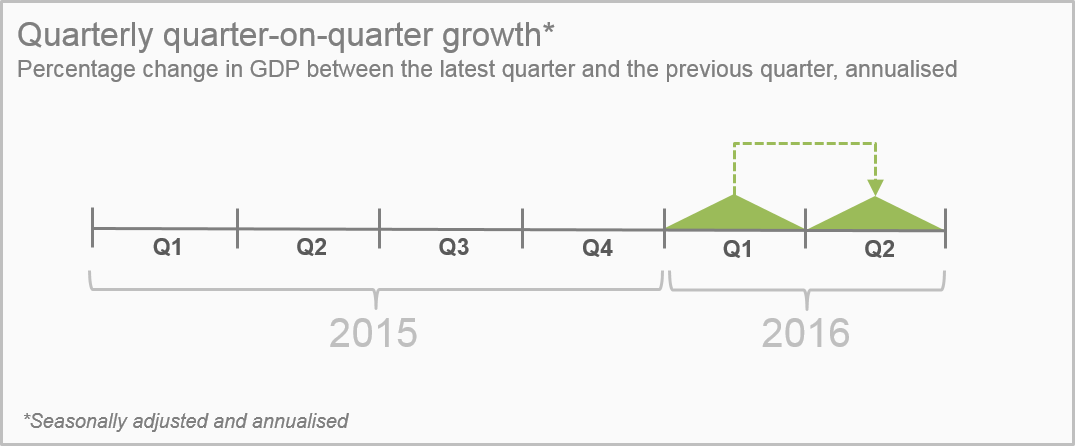
3. Quarterly quarter-on-quarter growth, seasonally adjusted and annualised (q/q saa) (this is the headline rate of GDP growth)
This is the percentage change between the latest quarter and the previous quarter, using seasonally adjusted GDP and annualised. It is the headline growth rate (the rate that Stats SA focuses on in presenting the GDP results). For example, seasonally adjusted real GDP increased from R761,3bn in Q1: 2016 to R767,5bn in Q2: 2016 (see Figure 3), which was a growth rate (q/q saa) of 3,3% (see Figure 4). The calculation is as follows: (767,5 ÷ 761,3)4 x 100 – 100 = 3,3.
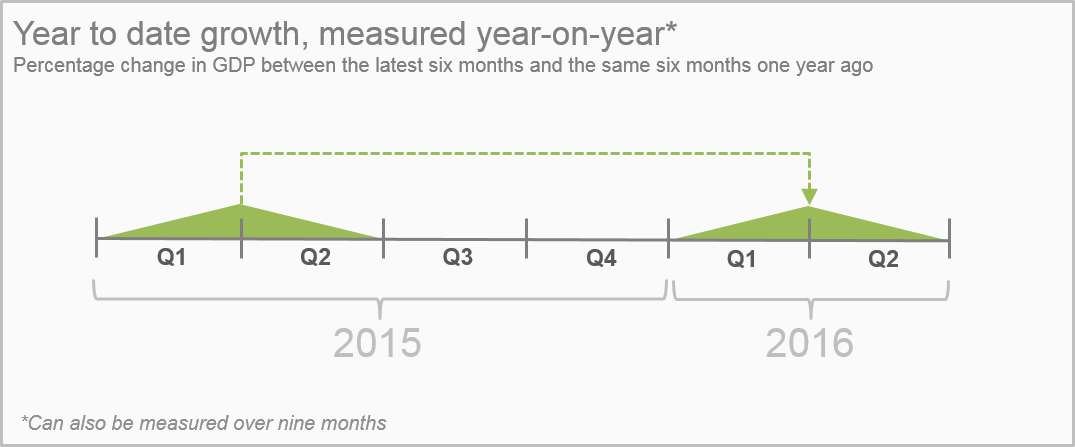
4. Year to date growth, measured year-on-year
This is the percentage change between the latest six months (or latest nine months) and the same six months (or same nine months) one year ago. For example, real GDP increased from R1 509,9bn in the first two quarters (six months) of 2015 to R1 513,8bn in the first two quarters of 2016, which was a growth rate of 0,3%.
To assess how the economy is really performing on a quarterly basis, economists usually take the different GDP growth rates into account in their analysis, namely the headline q/q saa rate for the latest quarter; the year-on-year rate for the latest quarter; and the year-on-year rate for the year to date. Only rarely, if ever, will these three rates be the same. If all three are positive, or if all three are negative, their interpretation is generally not too troublesome. It’s when the positives and negatives, or ups and downs, occur together that things can get confusing; but that’s the price, or perhaps the benefit, of having GDP results that come out quarterly instead of just once a year.
1A quarter-on-quarter growth rate of 2% becomes 8,2% when it is annualised.
(1 + 0,02)4 = 1,082.
1,082 x 100 – 100 = 8,2.
A quarter-on-quarter growth rate of -2% becomes -7,8% when it is annualised.
(1 – 0,02)4 = 0,922.
0,922 x 100 – 100 = -7,8.
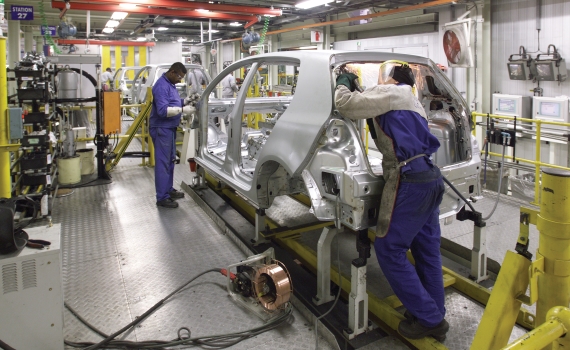
Photograph: Volkswagen South Africa, http://www.mediaclubsouthafrica.com/