
Tuition fee trends over time: what do the data show?
In a previous article, Stats SA outlined the importance of tuition fees – as a portion of total income – to the financial security of higher education institutions (HEIs)1 for the 2015 financial year. In this article, we provide a 10-year perspective of tuition fees to assess the significance of this source of HEI income.
To recap, let’s look at the year 2015, using data from the recently published Financial statistics of higher education institutions report2. Just over a third of total 2015 HEI income was obtained from tuition fees; 42,6% was in the form of grants, and the remaining 23,3% was generated through other receipts (such as donations, returns on investments and contractual work). Total expenditure amounted to R54,1 billion, with the bulk of spending being on employee salaries (58%), followed by goods and services (such as rental, electricity, repairs and maintenance), ‘other’ payments (such as bursaries) and interest.
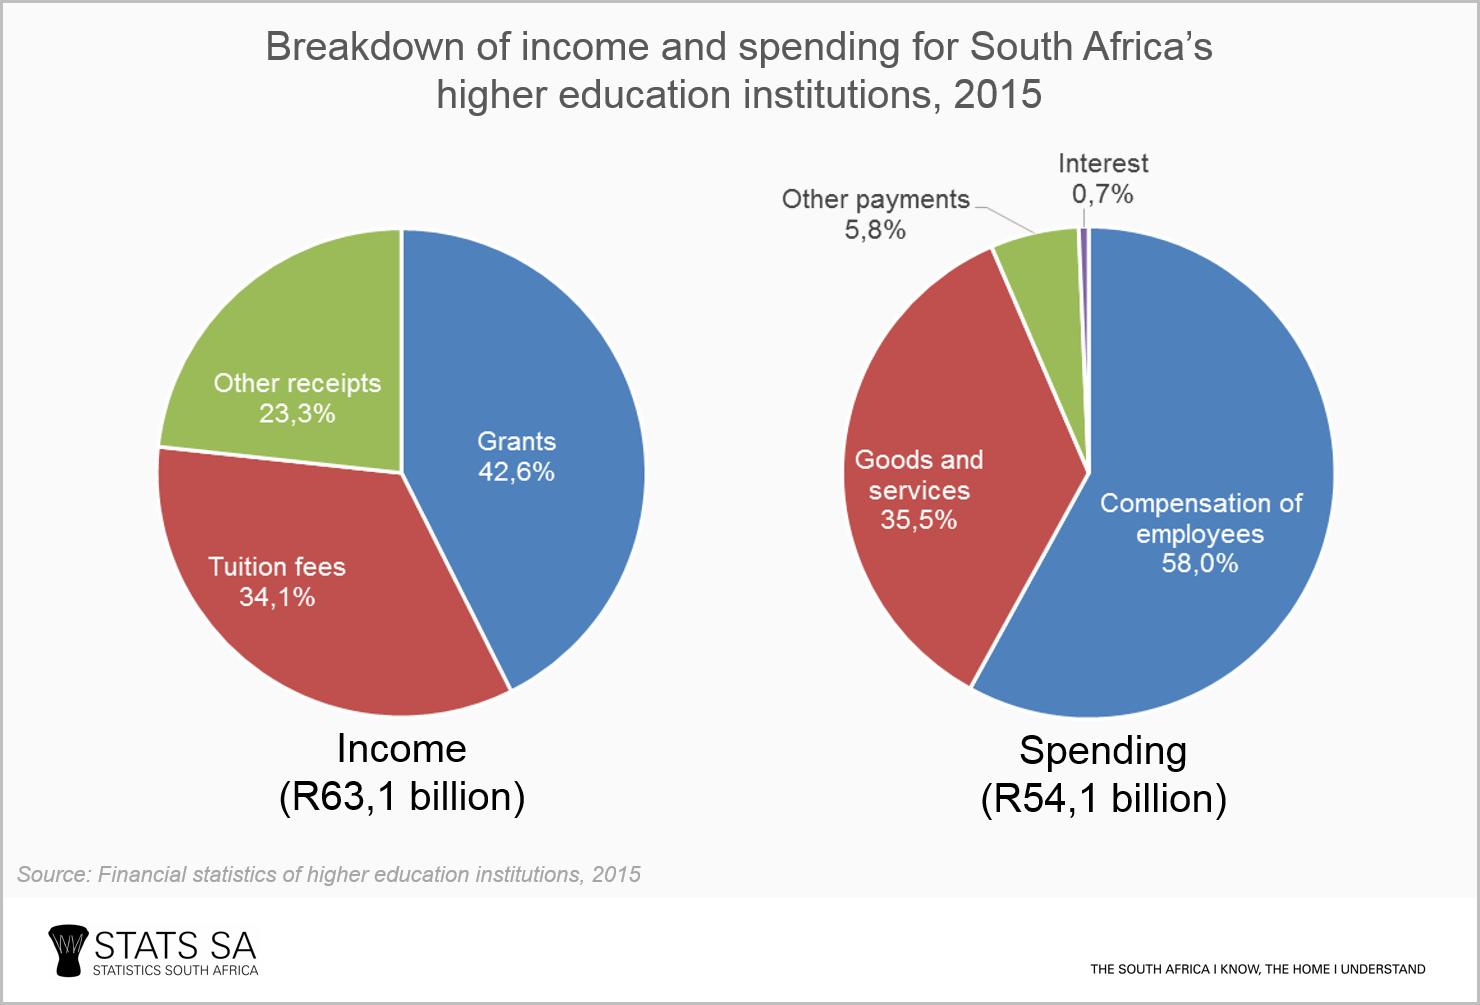
The above shows how important tuition fees are in financing South Africa’s 20 universities and 6 universities of technology, contributing R21,5 billion of total income.
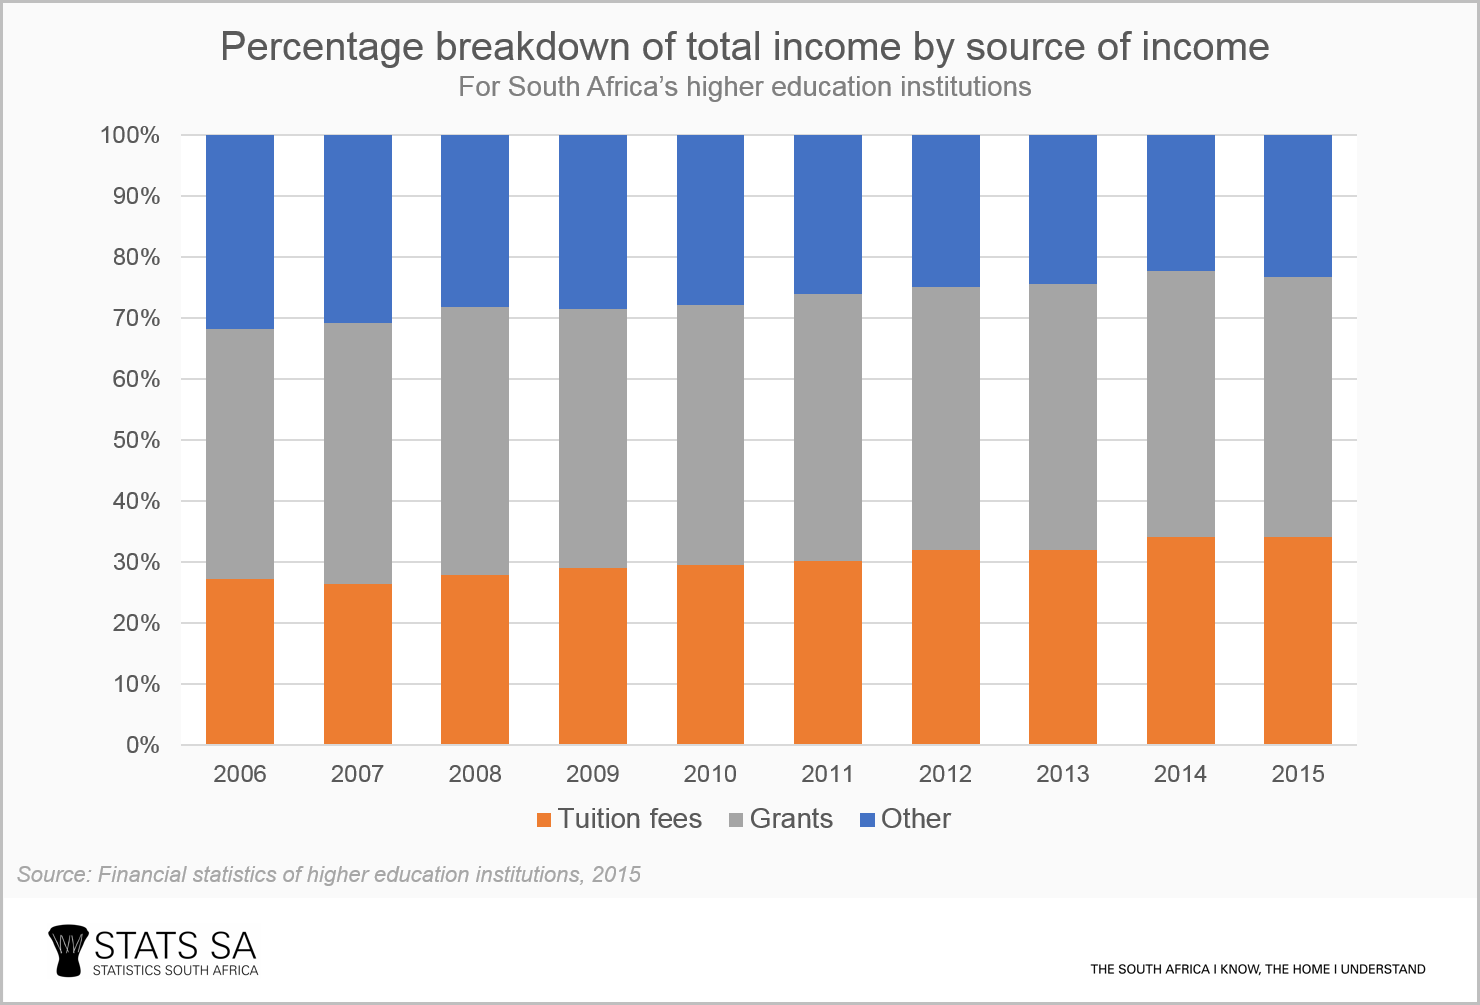
How has this changed over time? In 2006, 27% of total income was received in the form of tuition fees. By 2015, this had grown to 34%. This shows that HEIs depend on tuition fees more than ever before. The contribution of government grants climbed marginally over the same period, with a drop in the importance of donations and other income.
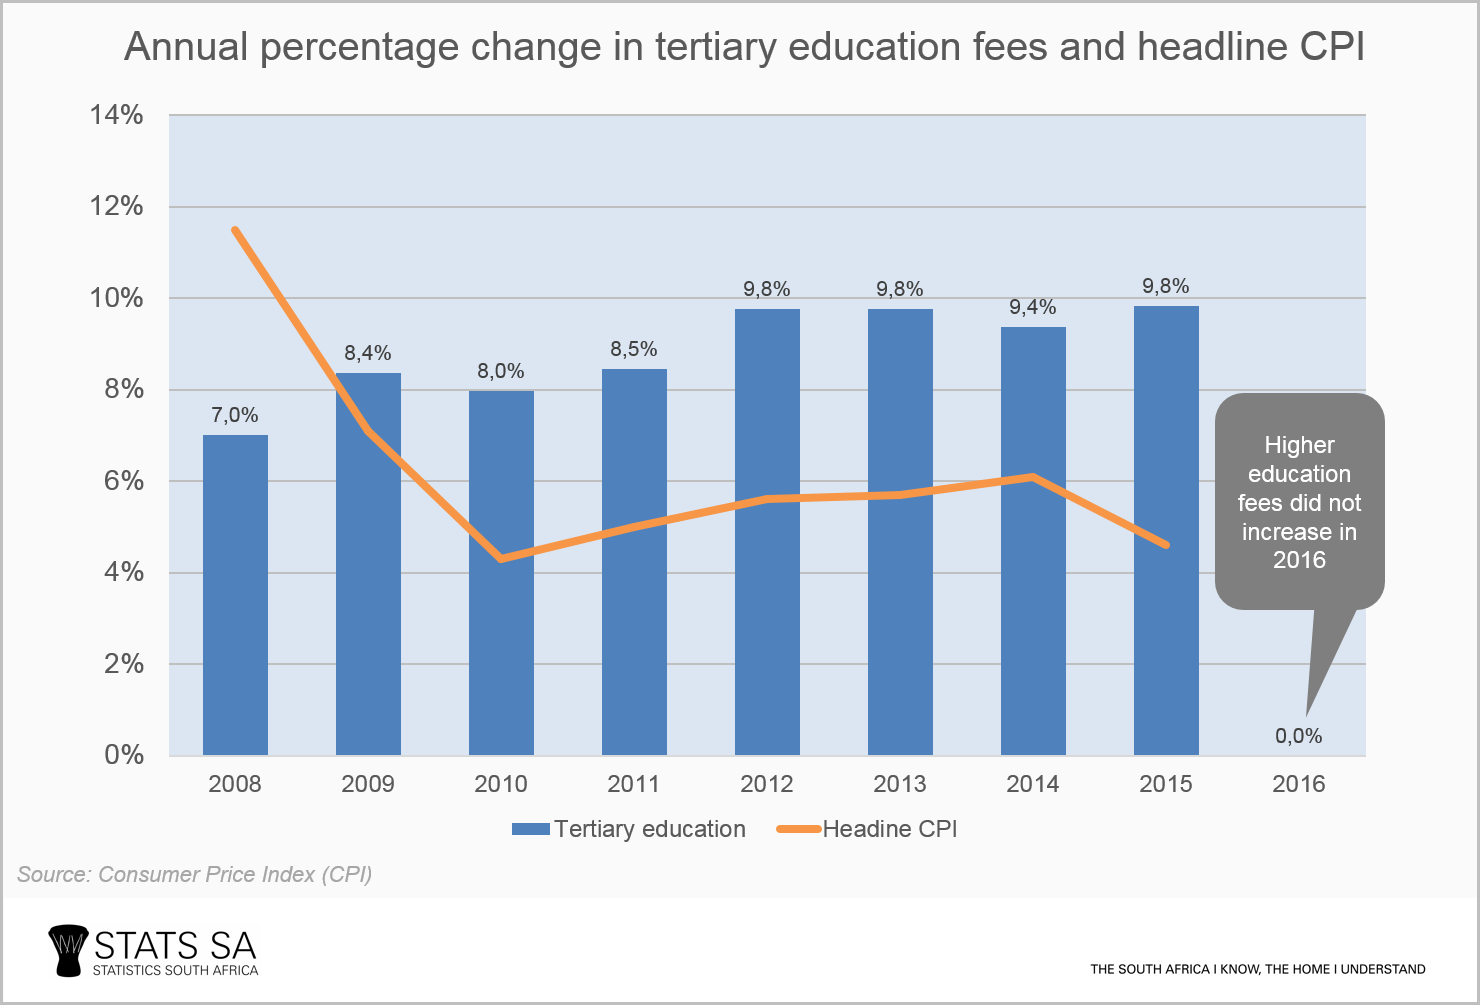
In October 2015, government announced that there would be no rise in fees in the 2016 academic year, as a direct response to the Fees Must Fall protests. This is reflected in the graph below showing data from Stats SA’s Consumer Price Index (CPI)3. During 2008–2015, the average annual increase in tertiary education fees was 8,8%. This was well above the headline CPI average annual increase of 6,2% over the same period. In other words, before 2016, tertiary education fees were rising faster than the average price of the CPI basket of goods and services.
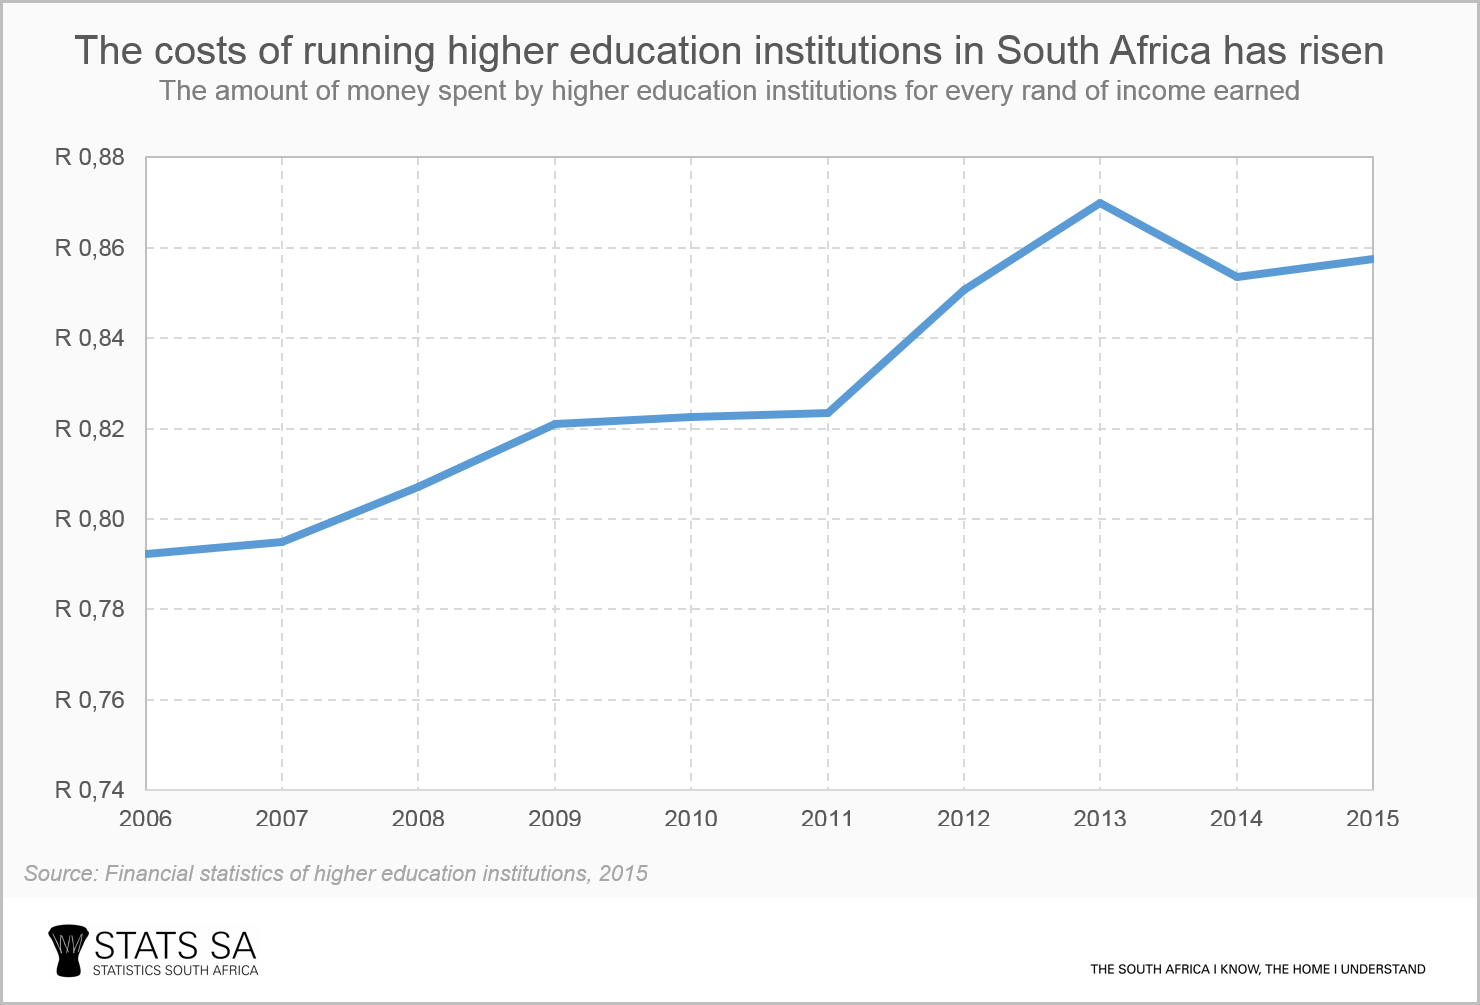
The costs of running HEIs have risen rapidly. From 2006 to 2015, HEI spending increased on average by 10,9% per year, while the amount of revenue received climbed by 9,9%. The graph below shows that for every rand of income earned in 2006, higher education institutions spent 79c. This climbed to 86c in 2015.
So not only do HEIs depend heavily on tuition fees, but their reliance on this income source has grown over the years. This is likely to change, however. In October 2016, government announced plans to increase higher education funding by R17,6 billion over the next three years. This means that income from government grants will form a larger portion of HEI income, but these institutions will still rely on both tuition fees and other receipts to ensure their financial sustainability.
1 Read Stats SA’s first article on tuition fees here.
2 Visit the download page for the latest Financial statistics of higher education institutions here.
3 Education fee data for the year are collected every March from institutions across the country. Download the CPI March release here.
Photograph: Hannelie Coetzee, http://www.mediaclubsouthafrica.com/