
Electricity pushes up municipal spending in the June 2016 quarter
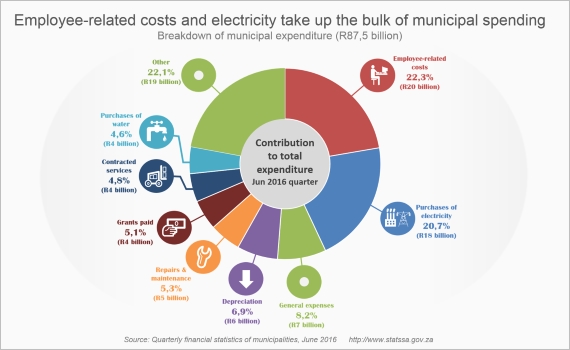
Total expenditure by municipalities increased by 21,9% (or R15,7 billion) in the June 2016 quarter compared with the March 2016 quarter, rising from R71,7 billion to R87,5 billion. Purchases of electricity by municipalities was one of the biggest contributors to this increase, according to Stats SA’s latest Quarterly financial statistics of municipalities report1.
Acting as intermediaries, municipalities buy electricity from Eskom in bulk and then re-sell it to various customers (including residents, businesses and government). During the quarter ending June 2016, municipalities spent 20,7% (or R18,1 billion) of their total budget buying electricity, the second largest expenditure item after employee-related costs.

However, municipalities sold the electricity for R23,1 billion over the same period, contributing 28,8% of total municipal income.
Eskom increased the price of electricity by 9,4% on 1 April 2016, shortly after the National Energy Regulator of South Africa (NERSA) approved the tariff rise for the 2016/17 financial year. With municipalities being a significant trader of electricity, it comes as no surprise that any jump in electricity tariffs would have an immediate impact on their statement of financial performance. The tariff increase contributed to municipalities spending R3,8 billion more for electricity in the June 2016 quarter compared with the March 2016 quarter, a rise of 26,6% from R14,3 billion to R18,1 billion.
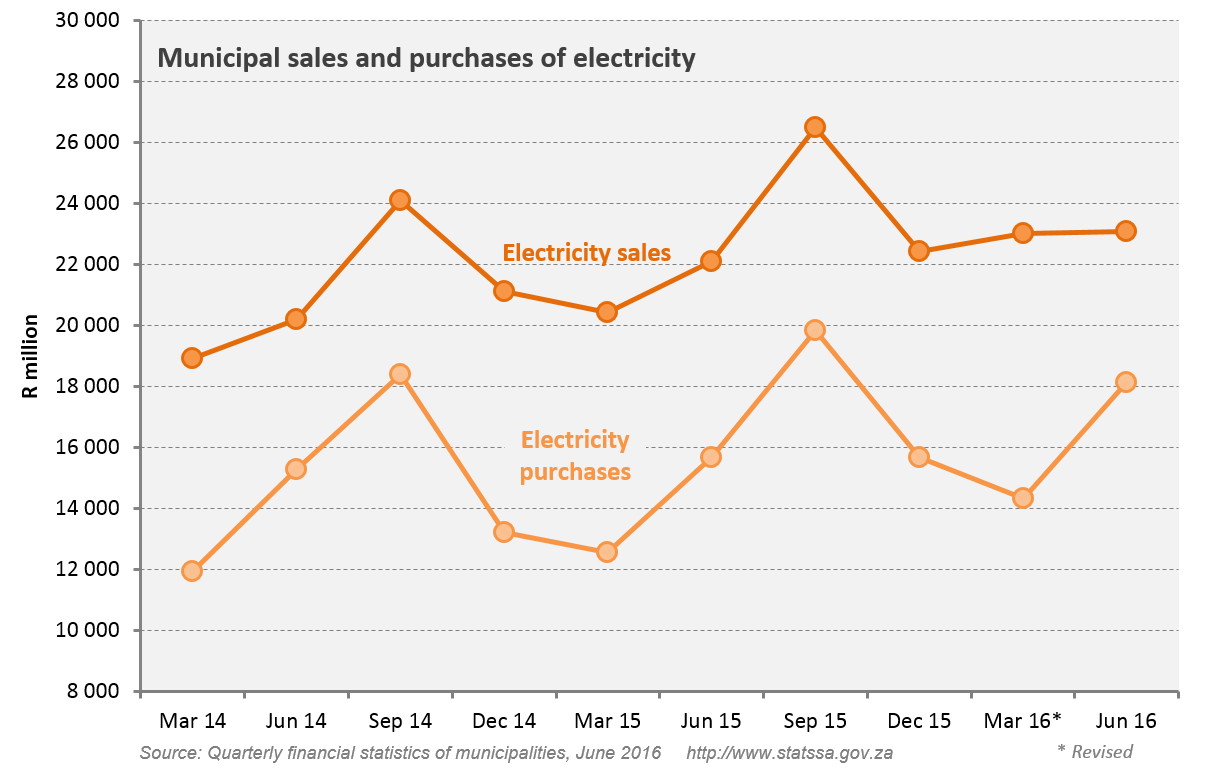
The other contributing factor to the rise in electricity spending is related to the weather: the June quarter covers part of winter, and municipalities purchase more electricity over this period to meet higher demand. Thus quarter-on-quarter changes should be seen in the context of seasonal patterns.
Other key results from the report:
- Metropolitan municipalities spent R51,7 billion (or 59,2%) of total municipal expenditure, followed by local municipalities with R30,1 billion (or 34,4%) and district municipalities with R5,6 billion (or 6,4%).
- The City of Johannesburg and Ekurhuleni were the largest contributors to total municipal expenditure with R12,4 billion and R10,0 billion respectively, followed by the City of Cape Town metropolitan municipality in the Western Cape (R8,5 billion) and the City of Tshwane metropolitan municipality in Gauteng (R 8,0 billion).
- Municipalities paid R4,6 billion on repairs and maintenance costs in the June 2016 quarter compared with R3,1 billion in the March 2016 quarter, which is mostly attributed to the repair and maintenance of road infrastructure in major metropolitan municipalities.
1 The Quarterly financial statistics of municipalities survey collects a range of financial data from municipalities. The report provides information on where municipalities source their income, and what they spend money on. The latest report provides data on the quarter ending June 2016 (i.e. the months of April, May and June). Download the report here.