
South African manufacturing production and the rand (an update)
Industry growth rates depend on many factors, and the South African manufacturing industry is no exception. The state of the local and global economy and the rand exchange rate are some of the factors that are watched closely when assessing the performance of manufacturing production.
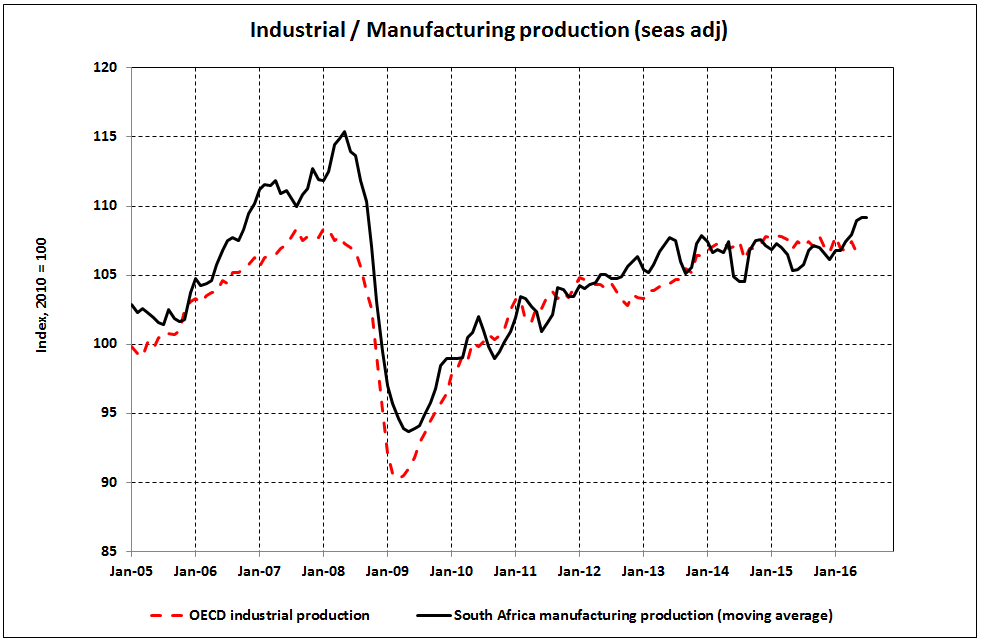
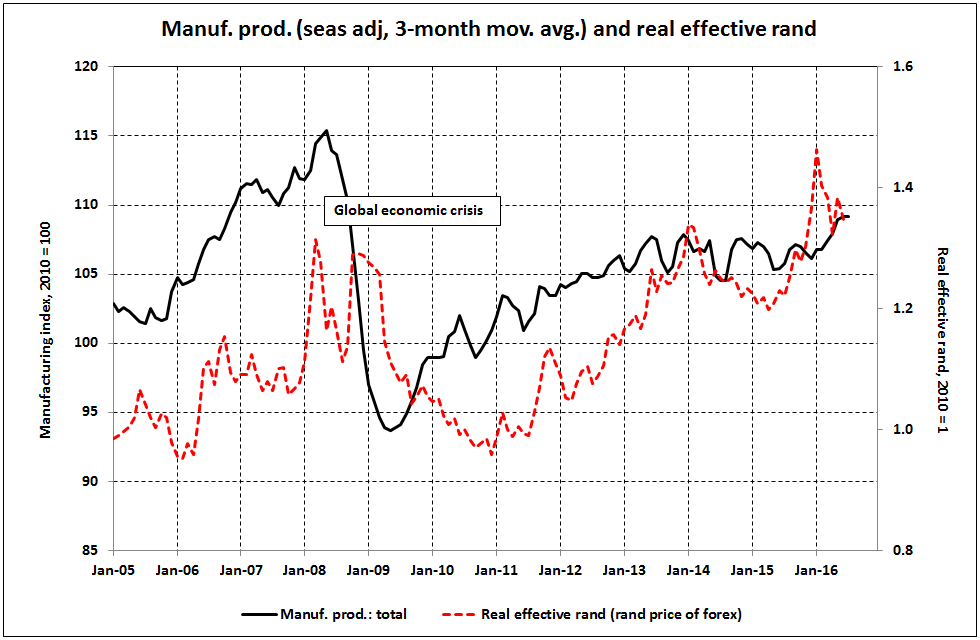
Figure 1 shows the severe impact of the global economic crisis of 2008/2009. Organisation for Economic Co-operation and Development (OECD) industrial production and South Africa’s manufacturing industry contracted sharply1. The subsequent recovery in South African manufacturing production has been insufficient for it to return to its pre-crisis level. In general, a strong global economy supports South African exports, and therefore economic growth, but during 2014 and 2015 OECD industrial production was generally flat, and on average for those two years growth in South African manufacturing was zero2.The flat performance of OECD industrial performance continued in the first half of 2016.
Figure 1
When the rand weakens against other currencies, the effects on South African manufacturers are mixed. Manufacturers who rely heavily on imports for their inputs are adversely affected by higher costs. But there are benefits for manufacturers who are big exporters or who face competition from imports. Exporters receive more revenue in rand terms for every unit of foreign exchange earned, and it becomes more expensive for importers to compete with local manufacturers. These benefits may be eroded over time if the weaker rand leads to higher inflation generally, e.g. labour costs may increase to compensate employees for a higher cost of living.
Figures 2 to 4 show the performance of the rand in three different ways: the R/$ exchange rate, the nominal effective rand and the real effective rand. In terms of monthly averages the rand reached its weakest level in January 2016. Percentage changes between January 2011 and January 2016 are shown in Table 1.
Figure 2
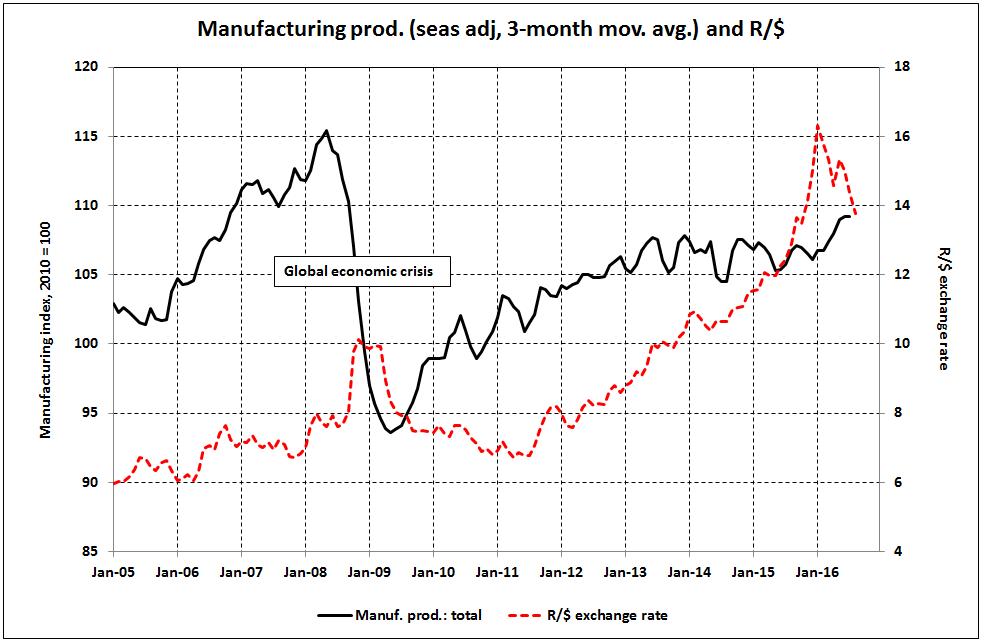
Table 1 – Percentage changes in the rand and manufacturing production
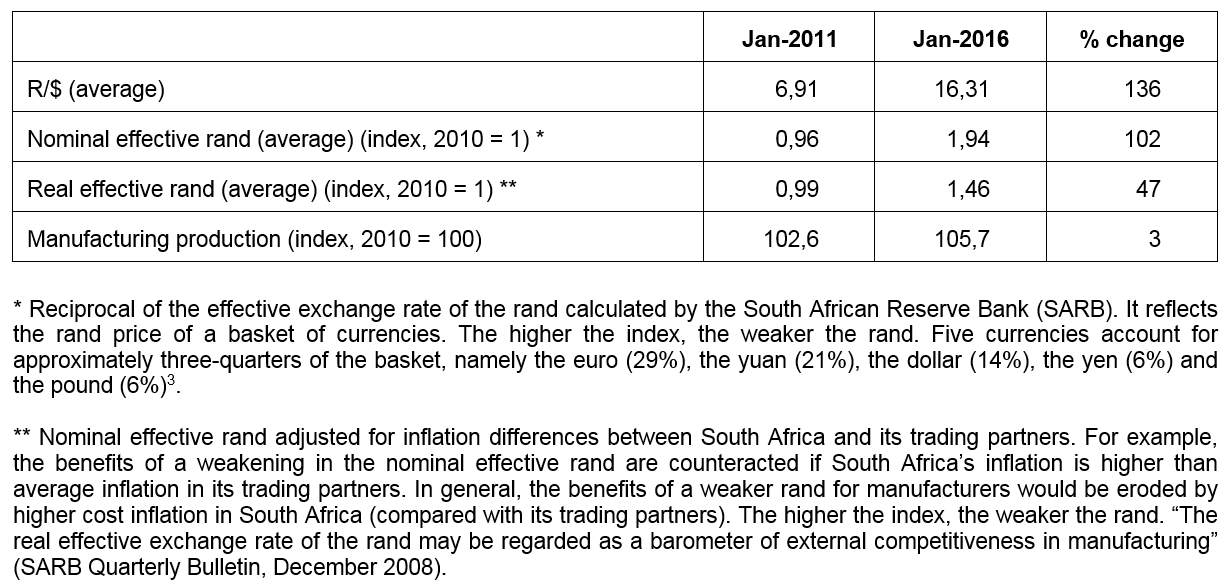
Figure 3
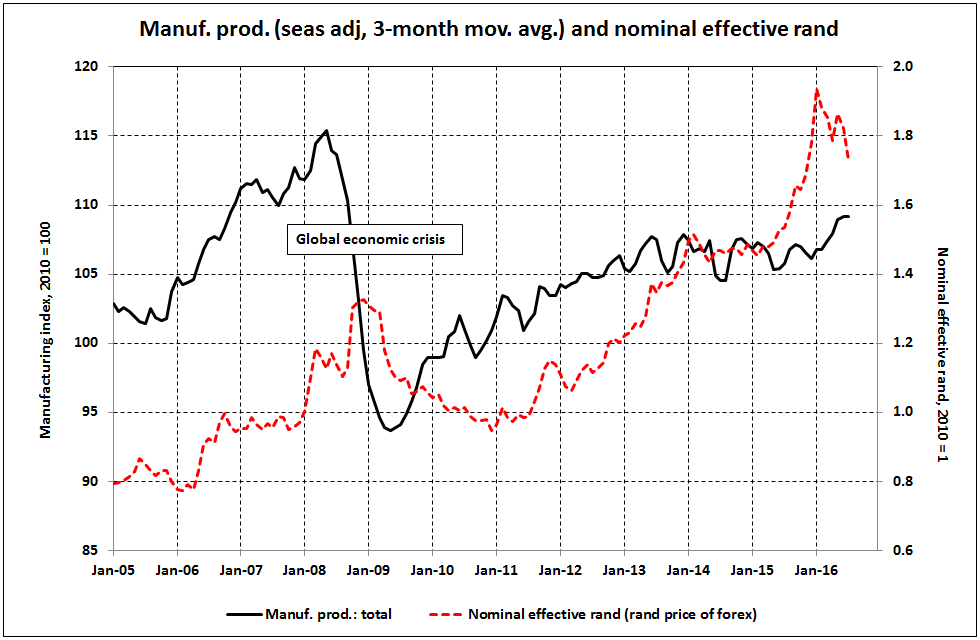
Figure 4
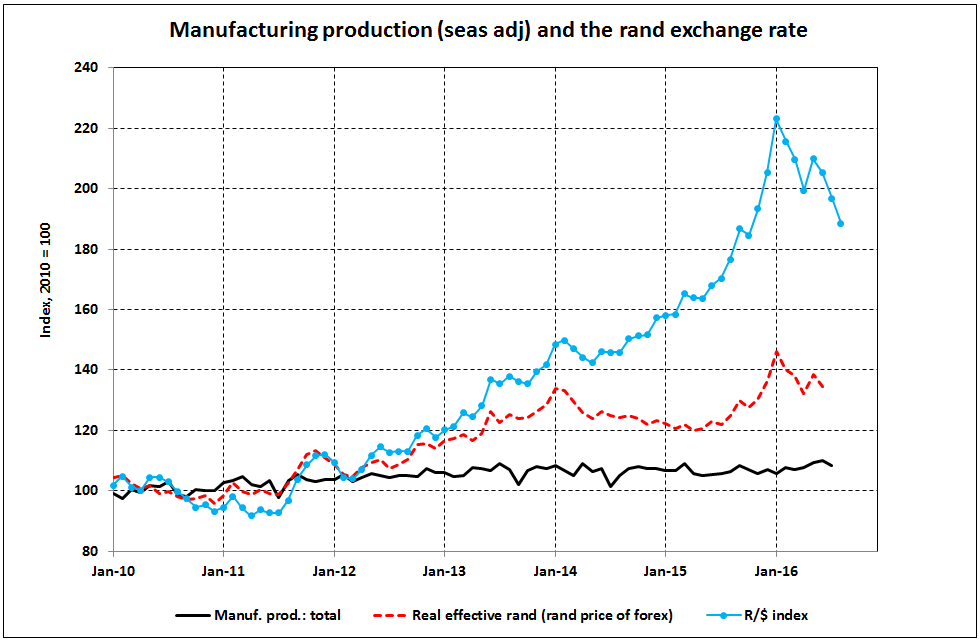
All three measures of the rand exchange rate show a much weaker rand between January 2011 and January 2016. The rand price of the dollar rose by 136%, and the rand price of the currency basket rose by 102%. Adjusted for inflation differences, the rand price of the basket rose by 47%. In contrast, manufacturing production rose by a mere 3%.
On a technical note, by using different axes for production (left axis) and the rand (right axis), Figures 2 to 4 show small movements in the variables clearly over an extended period – but there is a drawback: since the variables are on different axes, their relative movements are difficult to see (economics students please take note!). In Figure 5, all the variables are shown as index numbers (with 2010 = 100) on the same axis. Their divergence and the large differences in the percentage changes shown in Table 1 are clearly evident.
Figure 5
Manufacturing production grew by 0,3% in the first quarter of 2016 and by a further 2,1% in the second quarter (quarter-on-quarter, seasonally adjusted). Possibly some of this recovery was aided by rand weakness that occurred in 2015, but the bigger picture (Figure 5) does not suggest strong evidence of the manufacturing industry as a whole benefiting significantly from a weaker rand. The preliminary outcome for July 20164 shows a fall of 1,5% month-on-month in manufacturing production, and it should be noted that during February to August 2016 there was a substantial recovery in the rand.
Table 2 provides an update of the 10 manufacturing divisions. Measured year-on-year, the performance was quite evenly mixed in the seven-month period January to July 2016, with five divisions showing positive growth and five divisions showing negative growth. The strongest performer was communication and professional equipment (11,1%), but that was more the consequence of a low base in 2015 than strong growth in 2016. Apart from the “other” division, the weakest performer was metals and machinery (‑3,8%).
Table 2 – Annual percentage change in manufacturing production (volume)
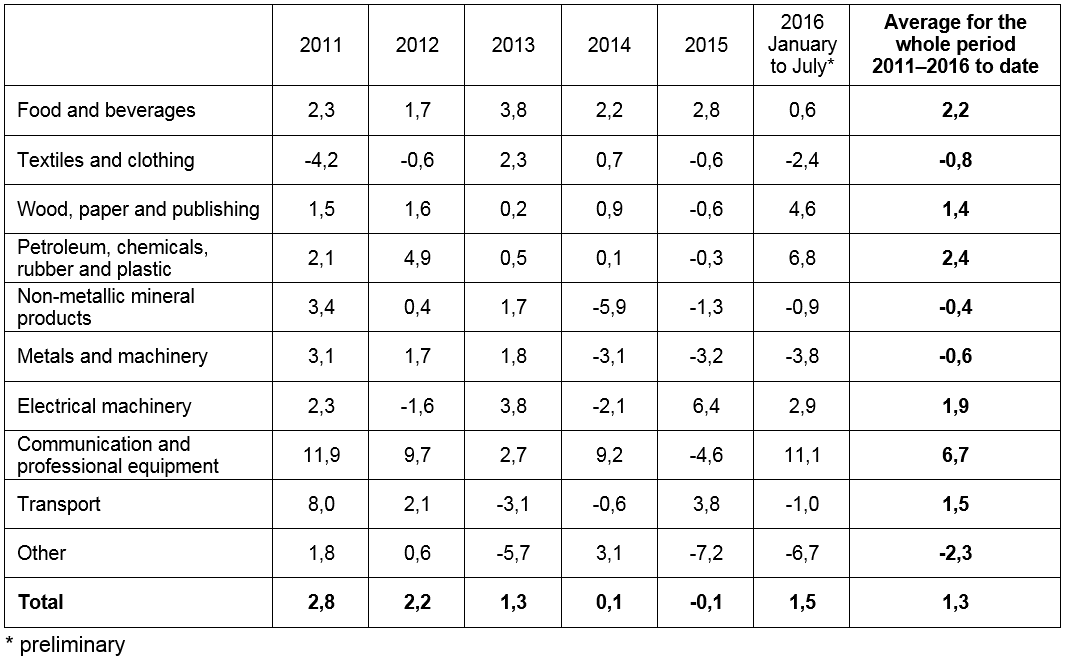
Table 2 demonstrates that there are vast differences in the performance of the manufacturing divisions, and within divisions the differences can also be substantial. Some manufacturers will be much more sensitive to the rand exchange rate than others, and those that are sensitive could have quite different response times. So sweeping generalisations should be avoided, but for total manufacturing production as a whole, it seems that rand weakness since 2011 has not provided the stimulus to manufacturing that many may have hoped for.
1 “Industrial production refers to the output of industrial establishments and covers sectors such as mining, manufacturing and public utilities (electricity, gas and water).” Organisation for Economic Co-operation and Development.
2 Visit the archive for the Manufacturing: Production and sales release here.
3 South African Reserve Bank Quarterly Bulletin. Visit the SARB website here.
4 See the July 2016 Manufacturing: Production and sales release here.
Click here for the previous story covering manufacturing and the exchange rate.
Photo: Rodger Bosch, http://www.mediaclubsouthafrica.com/