Gender equality: have municipalities walked the talk?
As the dust settles from the municipal elections, new faces are bound to fill leadership positions within many municipalities. With National Women’s Day around the corner, Stats SA takes a current look at gender representation in local government, focusing on mayoral, managerial and councillor positions.
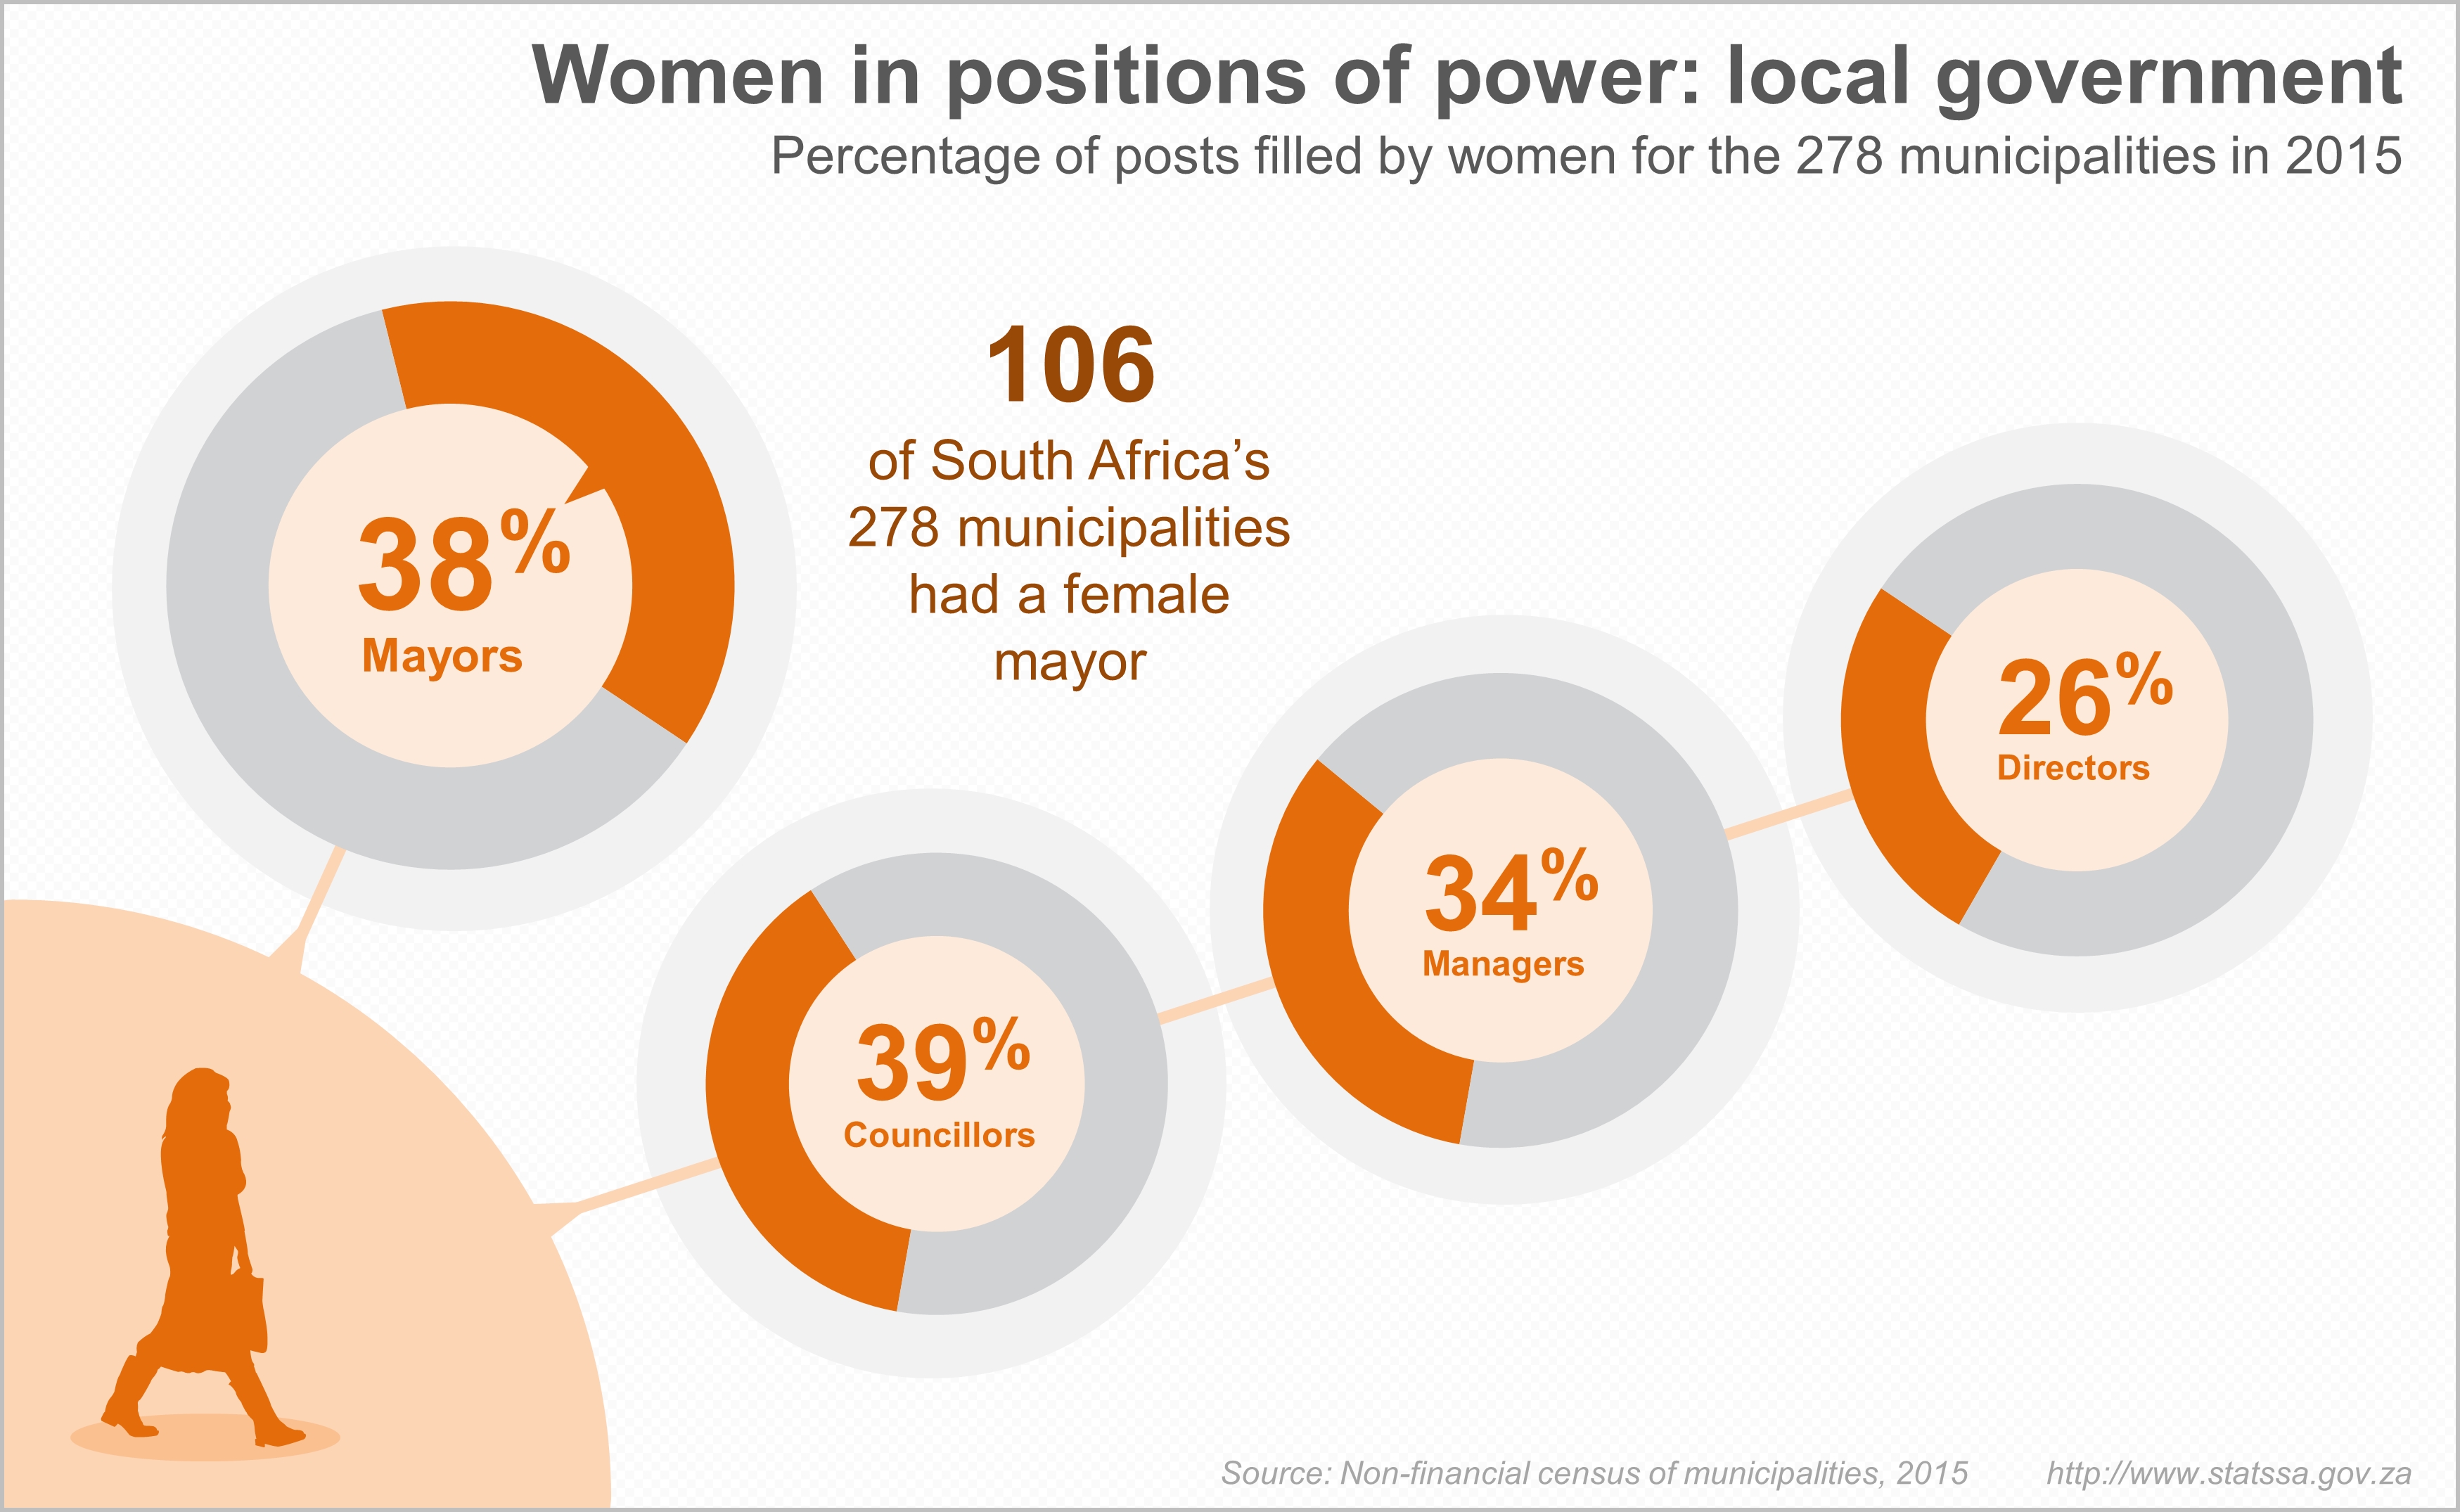
Municipal mayors
Representation: 38% and lower than before
You might not have heard of Daphne Kettledas, but in May 2015 she made history by becoming the first female mayor of Kouga municipality1. Located in Eastern Cape, Kouga is a popular tourist destination that includes the towns of Humansdorp, Jeffreys Bay and Hankey.
Mayor Kettledas was not alone. Nationally, 277 of South Africa’s 2782 municipalities had a sitting mayor, 106 (38%) of whom were women, according to Stats SA’s latest Non-financial census of municipalities report3. Limpopo had the highest representation, with 18 of its 30 (60%) municipalities headed by a female mayor. The province with the lowest representation was Western Cape (8 of 30 municipalities, or 27%).

Gender representation amongst those wearing the chain of office has fallen since 2011, from 42% to 38% in 2015. Eastern Cape, Mpumalanga and Limpopo were the only three provinces to experience a rise in the proportion of female mayors. The election of a new mayor takes place when the post becomes vacant or every five years just after municipal elections. The 2011 figures were taken just before the municipal elections of that year.
Of course, keep in mind that shifts and changes in mayoral posts were also affected by a number of municipalities merging after the 2011 elections, reducing the total number from 283 to 278.
Municipal management
Representation: 33% and higher than before
There are more women than men in South Africa, with women making up just over half of the country’s 55,6 million people4. Despite this, men still dominate positions of authority in many parts of society, in particular management. Women held 31% of management occupations in the labour force and 40% of senior public-sector management posts in 2014, according to Stats SA’s gender series report on economic empowerment5.
So how do municipalities square up?
A third of officials holding municipal management posts in 2015 were women (3 612 of 11 014 posts). A clear gender disparity exists if this figure is disaggregated by rank. Women were less represented in directorship posts in all provinces compared with lower management, with the exception of Free State. Nationally, only 26% of directors (413 of 1 567 posts) were women, compared with 34% of lower management (3 199 of 9 447 posts).
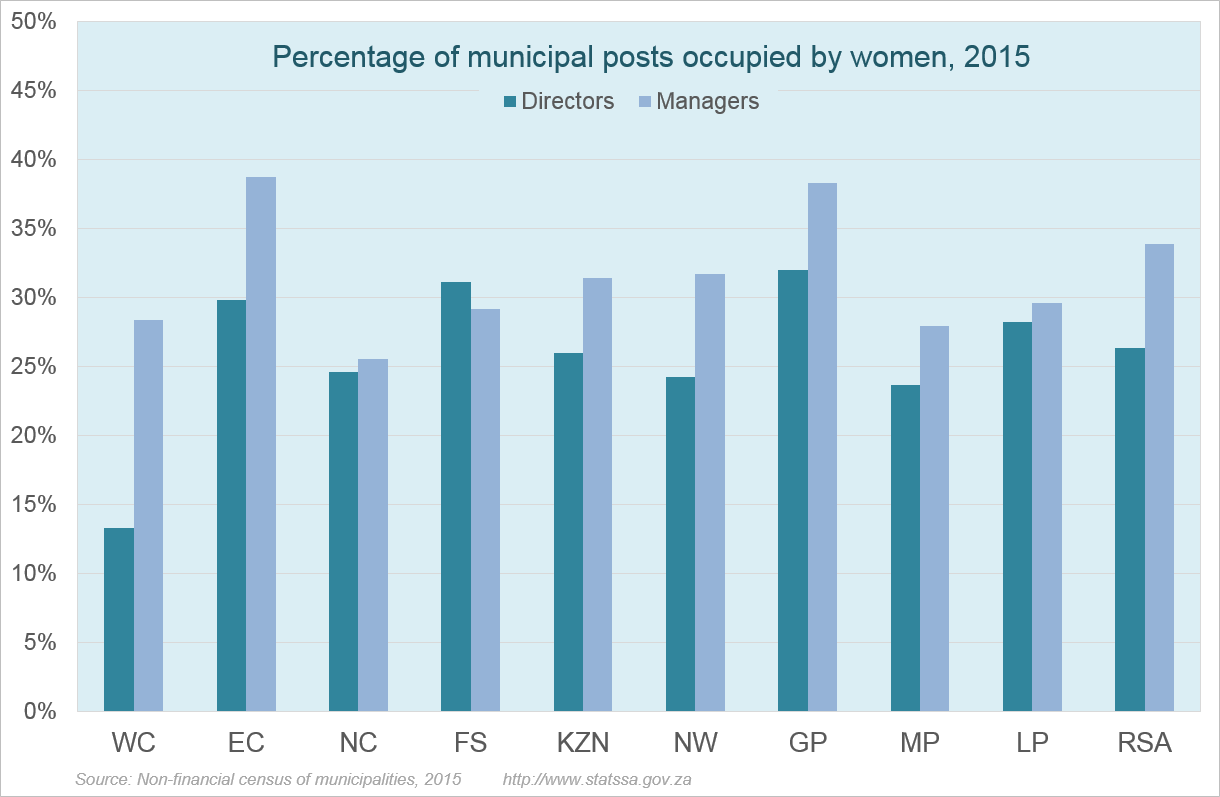
But there is good news. In contrast to mayoral posts, there was an increase nationwide in the proportion of women holding management posts (directors + lower management) at a local level, up from 28% in 2011 to 33% in 2015.
Municipal councillors
Representation: 39% and remaining steady
Sitting at the coalface of South African public life, municipalities are responsible for providing vital services – such as water, electricity and sanitation – to communities across the country. Municipal councillors are representatives from these communities. In 2015, there were 9 676 councillors nation-wide, 3 792 (39%) of whom were female. Elected every five years during municipal elections, councillors sit on the municipal council, which is the decision-making and political body directing the mandate of the municipality.
Mpumalanga and Limpopo led with the highest proportion of female councillors (both at 43%), while Western Cape (35%) and KwaZulu-Natal (33%) had the lowest.
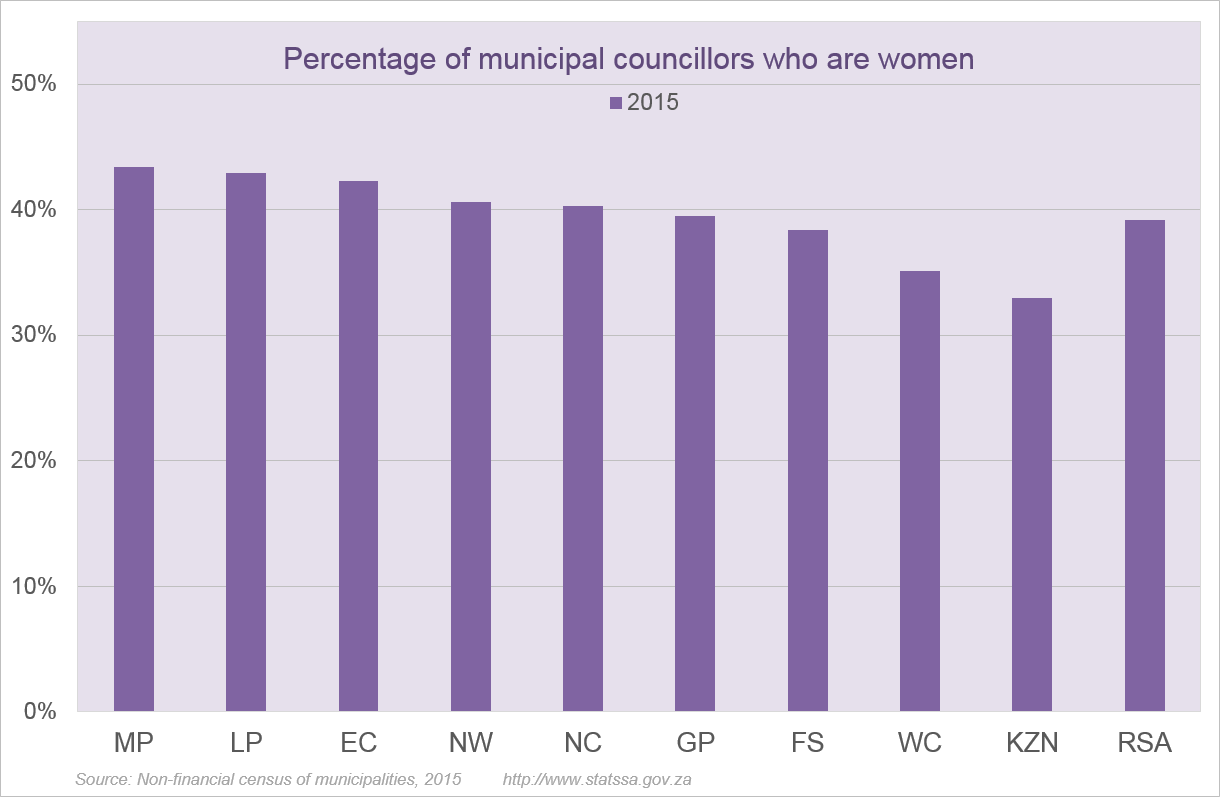
There has been no change in female representation between 2011 and 2015, with 39% recorded in both years.
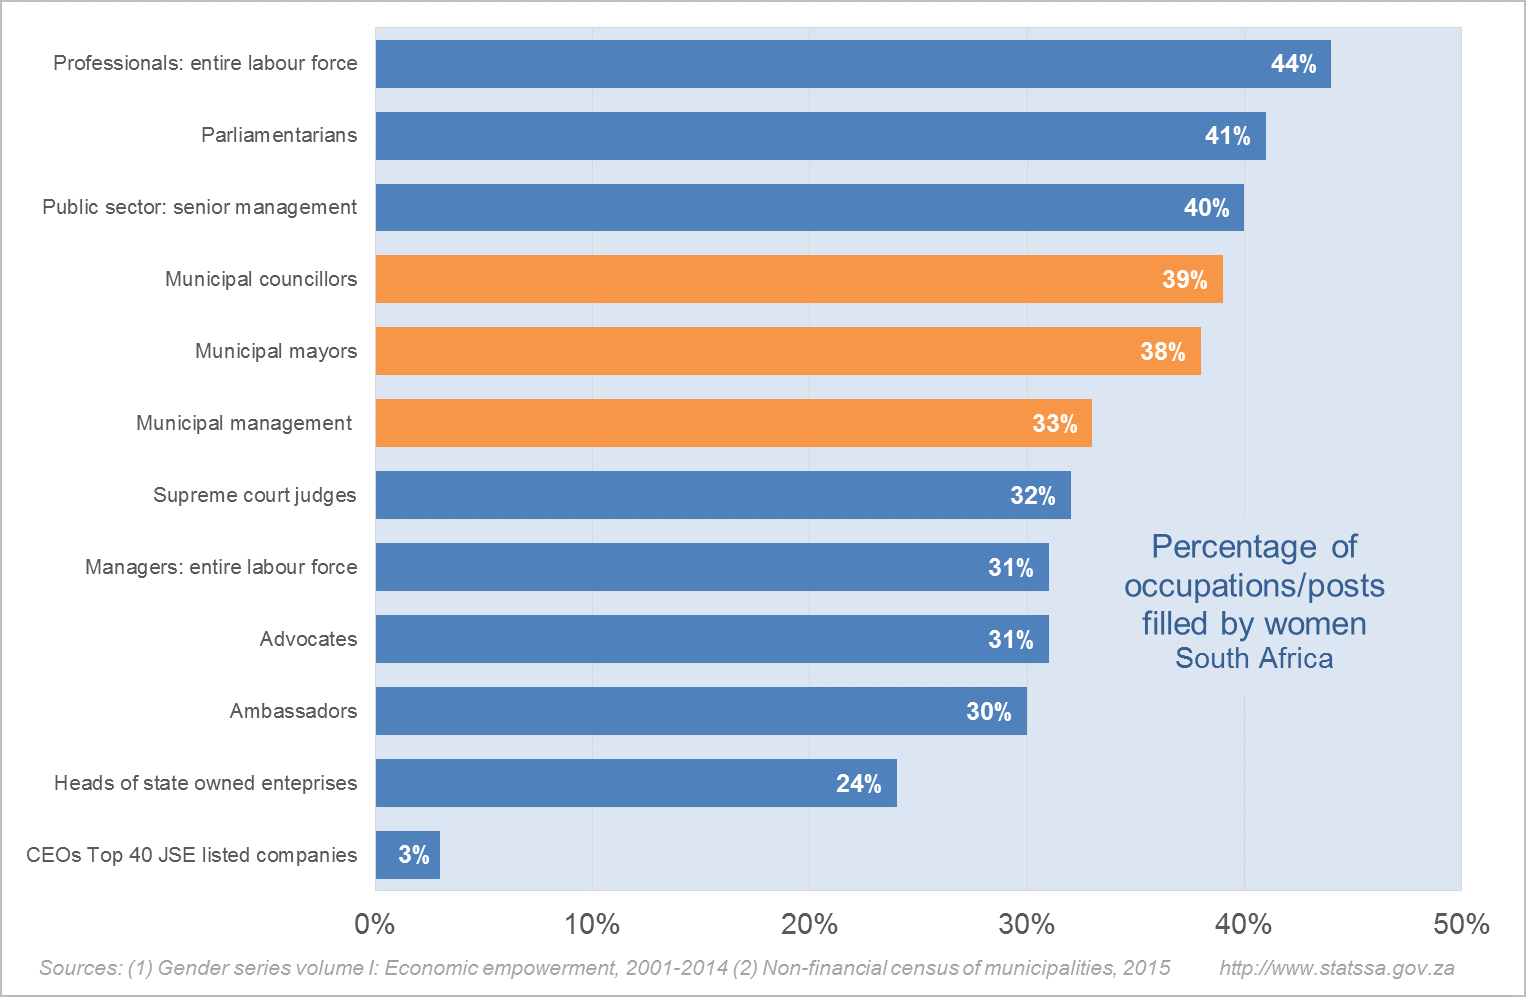
How does this compare with other sectors of society?
Gender equality is a founding principle set out in the Constitution. The Women Empowerment and Gender Equality Bill in particular indicates a target to achieve 50% representation of women in various spheres of society.
Stats SA’s gender series report on economic empowerment, with data from 2014, provides a snapshot of how far South African society has come in terms of reaching this target5. The municipal data are included in the chart below.
How will gender representation in municipalities change after the recent elections? We will soon find out.
1 Read more on Mayor Kettledas here.
2 South Africa consists of nine provinces that are divided into eight metropolitan and 44 district municipalities. The district municipalities are further divided into 226 local municipalities.
3 For more data on mayoral, managerial and councillor positions in 2015, download the Non-financial census of municipalities report and municipal data here.
4 Download the Community Survey reports here.
5 Download the Gender series volume I: Economic empowerment, 2001-2014 report here.