A ten-year snapshot of business profitability in South Africa
How well have South African businesses performed? This can be a complicated question that can be tackled with a range of indicators. From the wealth of financial data available from the recently published Quarterly Financial Statistics (QFS), Stats SA takes a look at one such indicator: the profit margin ratio.
A limitation of financial statements is that significant relationships and trends are not immediately evident from an examination of individual financial items. To dig a little deeper into the financial data, and thereby determine the health of a specific business or entire industry, accounting ratios can be used. These are calculated by comparing two or more financial values where an economic relationship exists, such as profit and sales (turnover).
Calculated ratios for a business can be compared over time or with the industry standard in which the business operates. Ratio analysis can provide significant insight into the performance and financial position of an enterprise and may be used in assessing its prospects.
The QFS survey1 conducted by Stats SA provides information on a range of financial variables related to income and expenditure, capital expenditure and inventories including selected operating financial ratios for each industry.
An interesting ratio and one that is growing in popularity is the profit margin, which is calculated by dividing the profit or loss before tax by sales or by turnover. The profit margin ratio measures how much of each rand earned by the industry is translated into profits and provides insight into the industry’s pricing policies, cost structure and production efficiency.
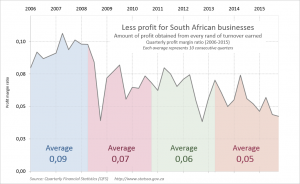
Dividing the last 10 years into 4 sets of 10 quarters, allows us to identify interesting results. As shown in the graph, the average profit margin for the South African formal business sector declined, from 0,09 between June 2006 and September 2008 to 0,05 between December 2013 and March 2016, showing that each unit of turnover generated less profit in the later period. The mining, electricity and transport sectors indicated significant decline in their average profit between June 2006–September 2008 and December 2013–March 2016.
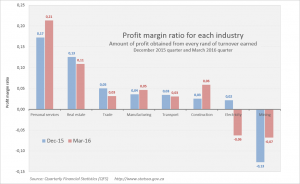
More recently, a comparison of the profit margin ratios by industry between the quarters ended December 2015 and March 2016 reflects that the ratio improved in four of the eight sectors covered by the survey. Mining, manufacturing, construction and personal services reflected an improvement. As a result of a net loss within the electricity, gas and water supply industry during the March 2016 quarter, the profit margin reflected a significant drop.
1Stats SA’s Quarterly Financial Statistics (QFS) Survey provides financial information on enterprises in the formal business sector: income and expenditure items, inventories, capital expenditure, the carrying value of assets and selected operating financial ratios. These estimates are widely used for various purposes, including comparative business and industry performance analyses.
Download the Quarterly Financial Statistics (QFS) report here.


