
How much do municipalities spend on salaries?
Municipalities spend more money on their employees than on any one of the services provided to their clients/customers. Data from Stats SA’s latest Financial census of municipalities provides interesting insight into the patterns of salary costs across municipalities, as well as over time.
Salary patterns across space
Employee-related costs took up the largest chunk of total municipal spend/expenditure for the 2014/15 financial year. For every R1 spent by South Africa’s 278 municipalities during the 12 months (July 2014 to June 2015), 26c was spent on salaries. Other budget items included electricity services (22c), bad debts (7c), the provision of water services (5c), contracted services (5c), and repairs and maintenance (5c). Other expenses (30c) included fuel and oil, audit fees, hiring costs, depreciation, remuneration of councillors, etc.
District municipalities tend to spend the largest proportion of their budgets on salaries. The 44 districts, taken together, devoted a third (33c of every R1) of their budgets to employee-related costs. District municipalities provide mostly an administrative function. Without the need to spend money on procuring services such as electricity and water, salaries will naturally take up a larger portion of the expenditure pie.
In fact, ZF Mgcawu District Municipality in the Northern Cape devoted two thirds (66c of every R1) of total spending to salaries in 2014/15, the highest of any municipality.
Compare this with the 226 local and 8 metropolitan municipalities which spend a larger bulk of their income on providing services. These municipalities spent 25c on salaries for every R1 of total expenditure in 2014/15.
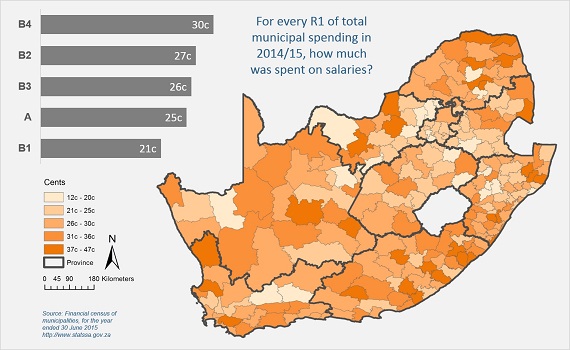
The Municipal Infrastructure Investment Framework (MIIF) divides local and metropolitan municipalities into five groups: metropolitan municipalities/large cities (A); secondary cities (B1); municipalities with a large town as its core (B2); municipalities with small towns (B3); and municipalities that are predominantly rural (B4).
The map below shows that B4 (rural) municipalities spent 30c of every R1 of total expenditure on employees in 2014/15. Metropolitan municipalities and secondary cities spent the least (25c and 21c respectively).

Salary patterns across time
Despite taking up the largest share of expenditure, the proportion spent on salaries by all municipalities has fallen slightly, from 27% (R45 billion) in the 2009/10 financial year to 26% (R73 billion) in 2014/15.
Over the same period, Nelson Mandela Bay had the largest increase in salaries compared with the other metropolitan municipalities (rising by 75%), followed by Ekurhuleni (up by 70%). Mangaung Metropolitan Municipality showed the smallest increase of all metropolitan municipalities, with salary costs rising by 54% between 2009/10 and 2014/15.
Over the last year, Imbabazane Local Municipality reported the largest rise in salary costs in 2014/15 compared with 2013/14 (rising by 132%), followed by Chris Hani District Municipality (up by 56%).
The smallest percentage increase in employee-related costs from 2013/14 to 2014/15 were reported by Sarah Baartman District Municipality (up by 0,9%) and Thabazimbi Local Municipality (rising by 1,1%).
Municipalities provided various reasons to account for the rise in salaries from 2013/14 to 2014/15. These include:
- Expenditure on salaries is driven by the need for labour as an input to providing services and running municipal administration.
- More interns were hired by most municipalities during the reference periods.
- Some municipalities provide employment by hiring people to undertake certain tasks that could be done using mechanisation.
- Some municipalities, which are largely located in poorer, rural parts of the country, had to pay excessive salaries in order to attract the appropriate skills.
Download the complete report here.