
What municipalities say about service delivery: the supply-side approach
If you are interested in the extent of service delivery in South Africa, it might be good to know that it can be measured from two different fronts. In most instances, the extent of service delivery is measured from the demand side. Surveys such as the Population Census, Community Survey (CS) and General Household Survey (GHS) collect data from households on the extent, type and quality of services that they receive.
Not as widely known is that service delivery can also be measured from the supply side. Municipalities (the suppliers) furnish service delivery related data to Stats SA during the annual Non-financial census of municipalities survey. The latest survey report, for the financial year ended 30 June 2015, provides information on the extent of provision of basic services and free basic services, compliance to certain minimum standards, vacancies in municipal departments, and the number of indigent households1.
Basic services
Municipalities provide a wide range of services. Basic services are those services that, if not provided, would endanger public health or safety. These include water, electricity, sewerage & sanitation, and solid waste management. The chart below shows that the number of consumer units2 receiving the four services has climbed over the last five years.
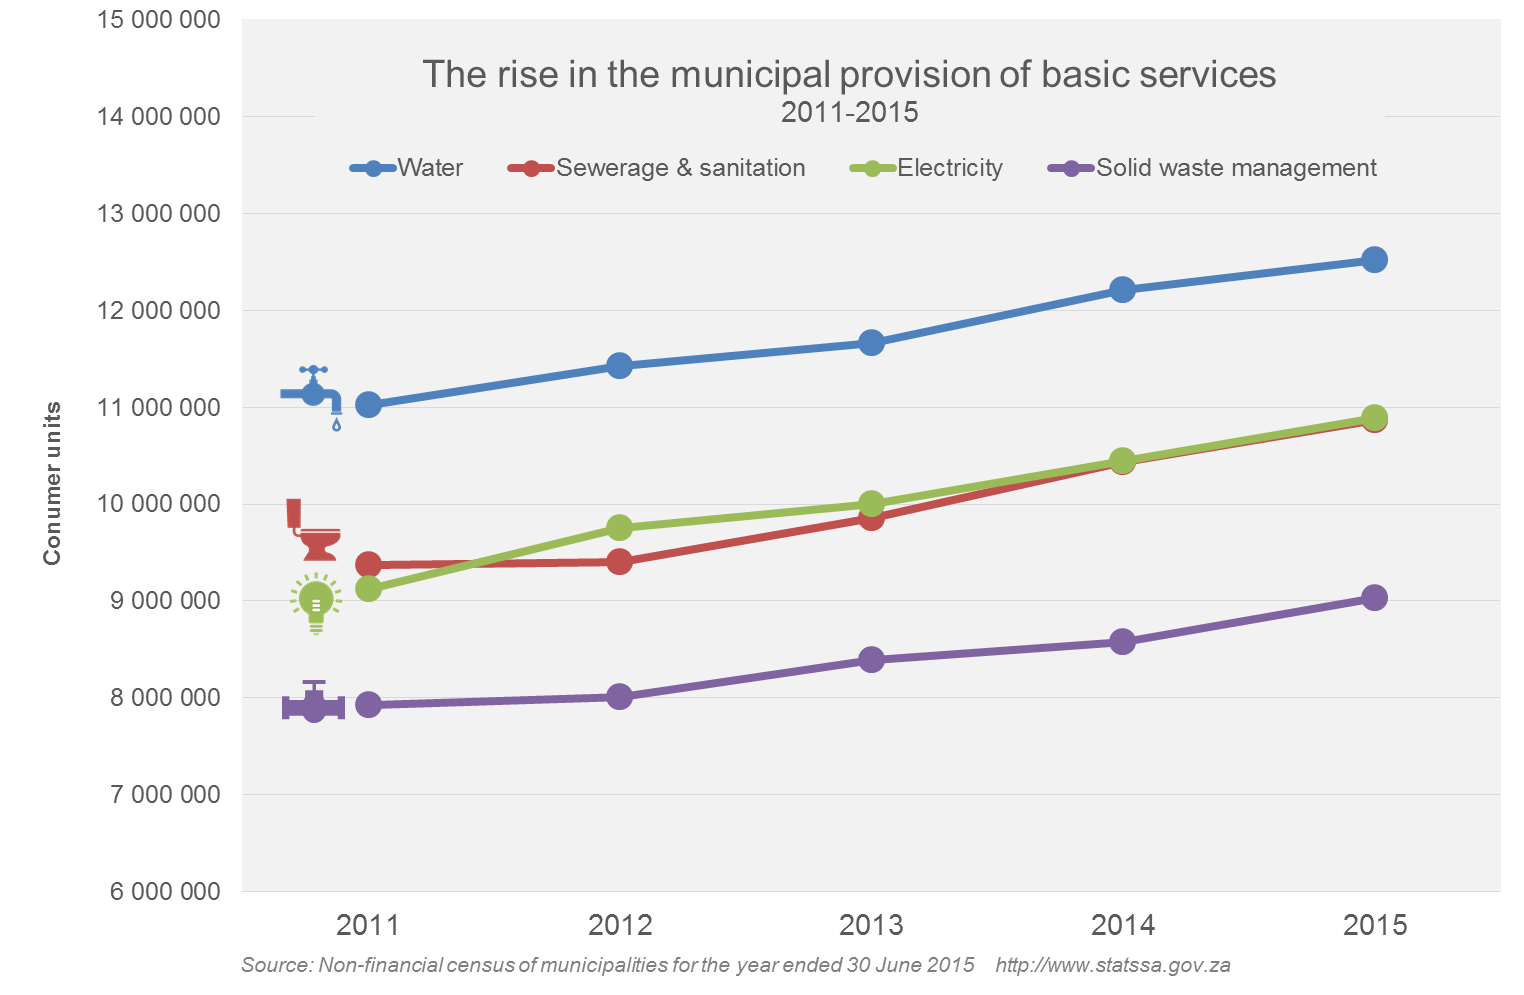
The provision of water rose nationally by 2,5% in 2015 compared with 2014, with the largest percentage increases occurring in Western Cape (5,0%) and Mpumalanga (3,1%). Over a five-year period, the largest percentage increase was reported for Gauteng. Of all the municipalities, Ekurhuleni Metropolitan Municipality exhibited the largest percentage rise as a result of new developments within the city.
The report shows that there was an increase in the number of bucket toilets supplied by municipalities, from 67 419 in 2011 to 80 119 in 2015. The province with the highest number of bucket toilets was Free State, contributing 40,6% (32 551 toilets) to the national total. Eastern Cape was in second place, with 28 757 toilets (35,9% of the national total).
Free basic services
In 2000, Cabinet announced government`s intention to roll out a free basic services programme to poor (or indigent) households. The objective of the indigent policy is to alleviate poverty in economically disadvantaged communities by providing free basic water (at least 6 kilolitres per month per household), free basic electricity (at least 50 kWh per month per household), and subsidised sewerage and sanitation as well as solid waste management (up to an average of R50 per month or 100% subsidy to indigent households).
2,7 million consumer units received free basic electricity from municipalities during the 2014/15 financial year, with the largest annual percentage increases recorded by municipalities in KwaZulu-Natal (18,4%) and Gauteng (13,3%). Over a five-year period, Gauteng had the largest percentage increase in consumer units receiving free basic electricity (from 344 709 in 2011 to 888 748 in 2015). On a local government level, Johannesburg reported the highest increase, from 130 000 in 2011 to 427 688 in 2015.
3,3 million consumer units received free basic sewerage and sanitation from municipalities in 2015, with the largest percentage increases recorded in Eastern Cape (17,2%) and Northern Cape (18,8%).
The provision of free basic solid waste management to consumer units dropped nationally by 2,3% in 2014/15, with the largest percentage decreases recorded in North West (-13,1%) and Western Cape (-10,2%).
1 Download the report here.
2 For all practical purposes, a consumer unit is a client who receives the service from the municipality (or the municipality’s customer). A consumer unit is not the same as a household.