
Vulnerable Groups Series I: The Social Profile of Youth, 2009–2014
| Media Release |
18 April 2016 |
|
Vulnerable Groups Series I: The Social Profile of Youth, 2009–2014
|
|
According to the Vulnerable Groups Series I: the social profile of youth, 2009-2014 the number of young people living below the poverty line decreased across all provinces; with Free State, Limpopo, and Northern Cape leading the pack with declines of 17, 12, and 11,6 percentage points respectively between 2009 and 2014. The number of youth entrepreneurs also declined from 609 000 in 2009 to 543 000 in 2014.
According to the report, the two leading causes of death amongst youth between 2009 and 2014 were ‘certain infectious and parasitic diseases’ (such as TB, intestinal infectious diseases, HIV, viral diseases) and ‘external causes of morbidity and mortality’ (such as car accidents, murder). However, the proportion of youth deaths caused by ‘certain infectious and parasitic diseases’ decreased by 2% from 40% in 2009 to 38% in 2014. On other hand, deaths caused by ‘external causes of morbidity and mortality’ increased to 30% in 2014, from 21% in 2009.
The report shows that the number of young people living in informal and traditional dwellings decreased between 2009 and 2014. The proportion of youths living in informal housing decreased from 13% in 2009 to 8,6% in 2014, while the proportion of youth living in traditional dwellings decreased from 11,3% to 9,6% over the same period. The proportion of youth living in overcrowded dwellings (six or more person households occupying one bedroom dwellings) decreased from 16,3% to 9,8%, between 2009 and 2014.
In 2014, South Africa had a youth population of a little over 19,5 million, with Gauteng being home to most of this population (4,5 million) and Northern Cape having the smallest share with 411 000 youths.
Selected key findings:
Distribution of SA and youth population (15 – 34 years) by province, 2009 and 2014
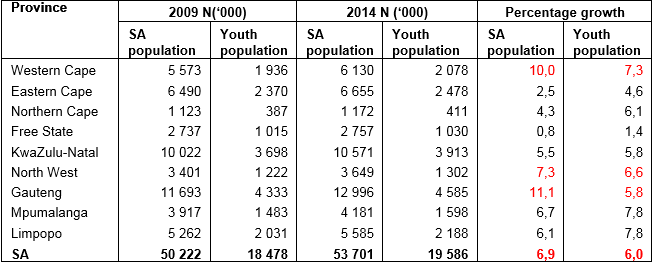
Source: GHS 2009, 2014
Demography
- The youth population grew by 6,0% between 2009 and 2014.
- However, the share of youth as a proportion of the total population declined slightly from 36, 8% to 36, 5% over the same period.
- This was mainly driven by negative growth observed among the white population (declined by 4,2%).
Youth migration
- Eastern Cape and Limpopo provinces lost larger proportions of their youth to other provinces. Gauteng province received a large proportion of youth from Limpopo, Mpumalanga and Free State. Western Cape received youth from Eastern Cape and Northern Cape.
- Net migration rates[1]
- Receiving provinces
Gauteng (428,8) and Western Cape (281,6)
- Losing provinces
Eastern Cape (-367,8) and Limpopo (-297,2)
Youth headed households
- Between 2009 and 2014, households headed by youth (15-34 yrs.) declined slightly from 27,5% in 2009 to 26, 1% in 2014. Decreases observed for both age categories: 0,3 percentage points for youth aged 15 to 24 years and 1,2 percentage points for those between the ages of 25 and 34 years.
Youth expenditure patterns
- In 2010/2011, expenditure on housing, water, electricity, gas and other fuels were the largest contributor to total annual household consumption expenditure amongst youth in both age group categories.
- 15-24 years: Second largest expenditure for those aged recorded on food and non-alcoholic beverage component (16,7%).
- 25 – 34 years: Second largest expenditure recorded on transport (19,8%)
Youth Labour Market Participation
Figure 5.2: Share of youth amongst the employed, 2009 and 2014
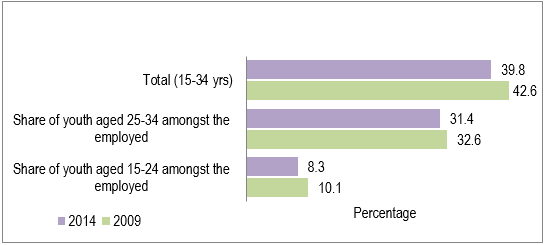
Source QLFS: 2009-2014
- The share of the youth (15-34yrs) amongst the employed declined by 2,9 percentage points (i.e. from 42,6% to 39,8%). The drop was slightly higher amongst those aged 15-24yrs (down by 1,7 percentage points) than for those between the aged 25-34 years (a drop of 1,2 percentage points).
- In 2014, about 2 million employed persons in the country were classified as entrepreneurs, 543 000 of which were youth.
- However the total share of young entrepreneurs declined by 2,6 percentage points between 2009 and 2014 (29,8% to 27,2%)
- A noticeable decline was observed amongst young females (down by 6,2 percentage points) as opposed to their male counterparts who recorded a drop of less than a percentage point (0,9).
- The share of unemployed youth dropped by almost 5 percent points between 2009 and 2014 (71,3% to 66,6%), mainly driven by younger persons between the ages of 15-24 years (30,3% to 26,2%).
- Youth with less than matric were most likely to be unemployed. Moreover, the share of unemployed young people with less than matric remained unchanged at 57% over the last five years of reporting
Youth and crime
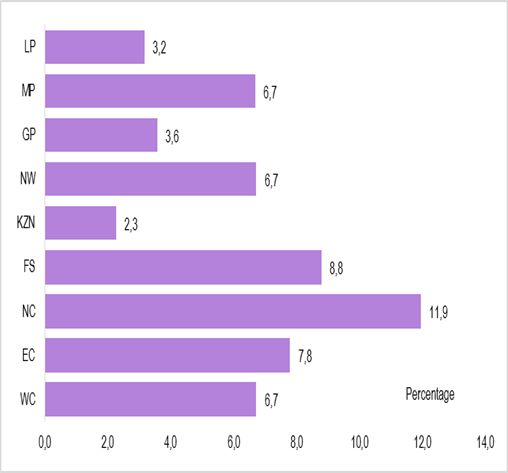
| Percentage of victims of assault by province 16 years and above, 2013/14 | Percentage of victims of assault (16 years and above) by age, 2013/14 |
Top eight causes of death for youth, 2008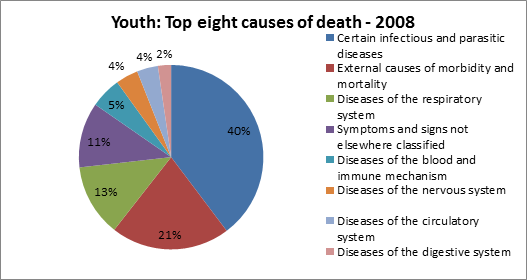
Source: Causes of death, 2008; 2013 |
Top eight causes of death for youth, 2013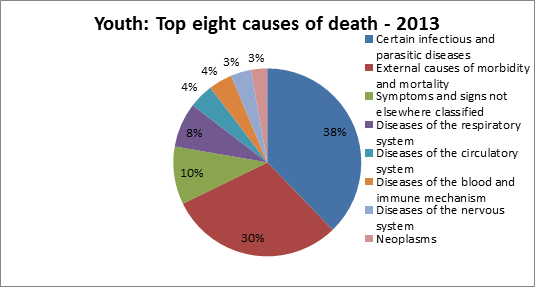 |
 |
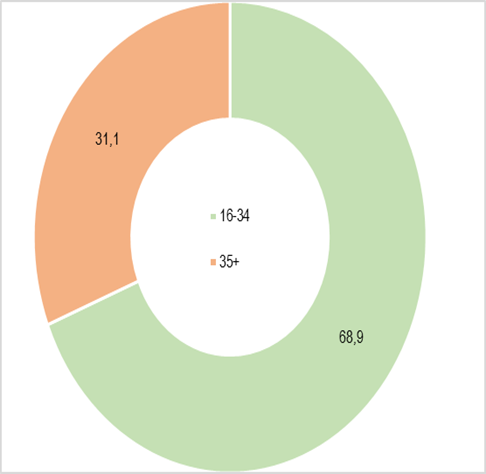 |
A higher percentage of youth aged 16-34 years were more likely to be victims and perpetrators of assault, robbery and property theft than adults.
- In both 2012/13 and 2013/14, younger youth between the ages of 16-24 years were recorded as victims of assault and property theft, while those experiencing robbery were older (25-34 years).
- The period, 2012/13 and 2013/14, saw a drop in youth assault and robbery perpetrators (4,1 and 5,4 percentage points respectively), while a noticeable increase of over 16 percentage points was observed among those committing assault.
Causes of youth morbidity and mortality
- Youth made up 21,1% of all recorded deaths for 2008. This percentage decreased to 16,4% in 2013 (16,9% for males and 15,9% for females).
- The two leading causes of death amongst youth were ‘certain infectious and parasitic diseases’ (e.g. TB, intestinal infectious diseases, HIV, viral diseases) and “external causes of morbidity and mortality’ (i.e. unnatural death e.g. car accidents, murder).
- Male youths mainly succumbed to “external causes of morbidity and mortality’ in both 2008 (34,7%) and 2013 (43,2%). The main cause of death for female youth was found to be ‘certain infectious and parasitic disease’ – 43,8% in 2008 and 44,8% in 2013.
Living conditions and poverty
- The proportion of youth accommodating households living in traditional and informal dwelling types decreased between 2009 and 2014 (decreased from 13,0% to 8,9% for traditional and 11,3% to 9,6% for informal dwellings.
- Decrease observed in proportions of households with youth living in overcrowding (six or more person households occupying one bedroom dwellings) during the period 2009 and 2014. In 2009, 16,3 percent of six or more person households in urban areas occupied one bedroom dwellings; this reduced to 9,8 percent in 2014.
Sources of household income
- In 2014 the main sources of income in all provinces for households with youth was salaries/ wages/commission at 50,8%, followed by grants (18,9%) and remittances (18,0%).
- Between 2009 and 2014, the largest decline in sources of income for households with youth was observed in grants down by 1,4 percentage points. The decline was driven by large decreases observed in Limpopo (down by 4,4 percentage points), KZN (down by 2,1 percentage points), and Gauteng (down by 2,0 percentage points).
Youth living below poverty line
- The percentage of youth living below the poverty line declined across all nine provinces. The largest drop was observed amongst those residing in the Free State (down by almost 17 percentage points). This was closely followed by noticeable decreases amongst youth living in Limpopo (12,5 percentage points), Northern Cape (11,6 percentage points) and Gauteng (9,9 percentage points).
Households that experienced hunger
- Hunger experiences in households with youth increased between 2010 (13,5%) and 2014 (16,2%). This was driven mostly by large increases in the Northern Cape (up from 19,4% to 29,0%)) and the Eastern Cape (up from 18,6% to 24,5%).
Note about the report:
The Vulnerable Groups Series I: the social profile of youth, 2009-2014 report is the first publication in its series. The purpose of this report is to provide analysis relating to the socio-economic and demographic profile of the youth in South Africa using mainly secondary data from Stats SA. The report offers a broad understanding of the situation of young people in the country by highlighting some challenges and successes experienced over a five year period (i.e. 2009 and 2014).
Issued by Statistics South Africa
Technical enquiries:
Ms. Kefiloe Masiteng
Deputy Director General: Population & Social Statistics
Tel: (012) 310 4663
Email: kefiloem@statssa.goc.za
Dr. Isabelle Schmidt
Executive Manager: Social Statistics
Tel: (012) 337 6379
Email:IsabelSc@statssa.gov.za
Media enquiries:
Ms Lesedi Dibakwane
Manager: Media Relations
Tel: (012) 310 8578
Cell: 082 805 7088
Email: LesediD@statssa.gov.za
[1] Figures in thousands