
South African manufacturing production and the exchange rate
The South African economy was hit hard by the global economic crisis of 2008/2009. The country’s manufacturing industry contracted sharply, and its subsequent recovery has been insufficient for the volume of manufacturing production to return to its pre-crisis level.
Figure 1 shows SA’s manufacturing production (volume) compared with OECD industrial production.1 Preliminary manufacturing data for December 2015 reveal that South Africa’s manufacturing production, on average, was unchanged in 2015 compared with 2014.2
Figure 1

The severe contraction of 2008/2009 was followed by a period of convalescence. Between mid-2009 and mid-2013, SA’s manufacturing production showed positive growth, but between mid-2013 and the end of 2015, growth in manufacturing production was generally flat.
There are many factors that influence the manufacturing industry, e.g. the global and domestic business cycles, productivity, business confidence, investment, industrial relations, input and output prices, monetary and fiscal policy, infrastructure, the rand exchange rate. The graphs that follow focus on manufacturing production and the exchange rate.
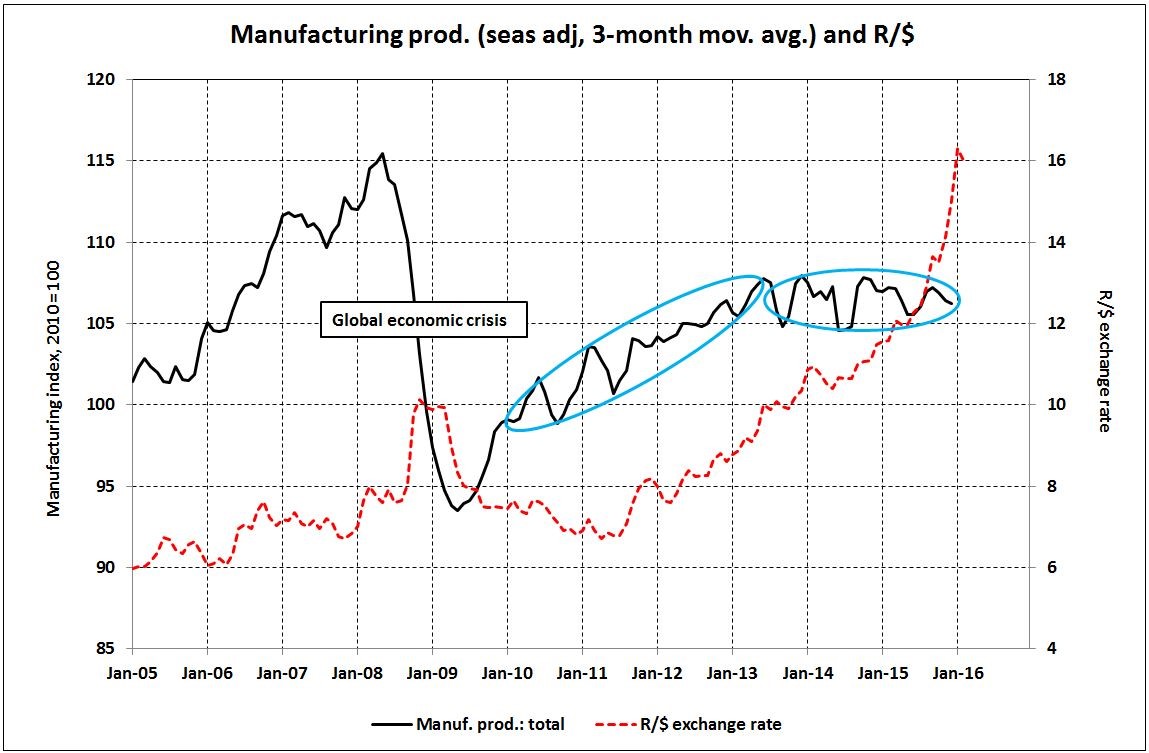
Figure 2 shows manufacturing production compared with the R/$ exchange rate. In the five-year period 2011 to 2015, the rand weakened from around R6,90/$ (Jan-2011) to around R15/$ (Dec-2015). Rand weakness tends to assist South African manufacturers in two ways. Firstly, manufacturing exporters receive more revenue in rand terms for every unit of foreign exchange received, and secondly, it becomes more expensive for importers to compete with local manufacturers who are in competition with them. These benefits may be eroded over time if the weaker rand and related factors result in cost inflation for manufacturers, e.g. more expensive imports (and for manufacturers who rely heavily on imports for their inputs, a weaker rand is not good news at all).
Between January 2011 and December 2015, the rand lost 54% of its value against the dollar (measured in terms of the dollar price of the rand). Following growth of 4,6% in 2010, manufacturing production slowed to 2,8% in 2011; 2,2% in 2012; 1,3% in 2013; 0,1% in 2014; and 0,0% in 2015.
Figure 2
However, comparing manufacturing production with the rand price of a basket of currencies (instead of the US dollar) provides a different perspective. The South African Reserve Bank (SARB) calculates the “effective exchange rate of the rand”, which shows changes in the value of the rand against a basket of currencies. Five currencies account for approximately three-quarters of the basket, namely the euro (29%), the yuan (21%), the dollar (14%), the yen (6%) and the pound (6%).3
The effective exchange rate of the rand is shown by the broken line in Figure 3. A higher value reflects a weakening of the rand (just as a higher rand/dollar rate also reflects a weakening of the rand). In nominal terms (which means there has been no adjustment for inflation), the effective rand weakened during 2011–2013, was relatively stable during much of 2014, and weakened during 2015.
Figure 3

Figure 4

The SARB also calculates the effective rand in real terms, which is the nominal effective rand adjusted for inflation differences between South Africa and its trading partners (see Figure 4). For example, the benefits of a weakening in the nominal effective rand are counteracted if South Africa’s inflation is higher than average inflation in its trading partners. In general, the benefits of a weaker rand for manufacturers would be eroded by higher cost inflation in South Africa (compared with its trading partners). “The real effective exchange rate of the rand may be regarded as a barometer of external competitiveness in manufacturing” (SARB Quarterly Bulletin, December 2008).
Figure 4 shows that the real effective rand weakened during 2011–2013, strengthened during 2014 and early 2015, and thereafter weakened again. The strengthening of the real effective rand in 2014 is a far cry from the weakening in the nominal rand/dollar exchange rate shown in Figure 2.
How will manufacturers fare in 2016? That remains to be seen! As noted earlier, there are multiple factors that affect manufacturing, which makes it difficult to quantify their individual impact. An additional complication in measuring economic relationships between variables is that there may be lags between causes and effects, e.g. exporters may need time to respond to a weaker exchange rate if they face supply-side constraints such as shortages of production capacity, labour, electricity and other inputs.
Finally, let’s take a brief look at the breakdown of manufacturing. There are 10 manufacturing divisions. Table 1 shows their performance in terms of production (volume) growth for the period 2011–2015.
Table 1 – Annual percentage change in manufacturing production (volume)
|
2011 |
2012 |
2013 |
2014 |
2015* |
Average for the whole period |
|
|
Food and beverages |
2,3 |
1,7 |
3,8 |
2,1 |
2,7 |
2,5 |
|
Textiles and clothing |
-4,2 |
-0,6 |
1,4 |
0,6 |
-1,0 |
-0,8 |
|
Wood, paper and publishing |
1,5 |
1,6 |
0,1 |
0,9 |
-0,5 |
0,7 |
|
Petroleum, chemicals, rubber and plastic |
2,1 |
4,9 |
0,8 |
0,1 |
-0,1 |
1,6 |
|
Non-metallic mineral products |
3,4 |
0,4 |
1,7 |
-5,9 |
-1,4 |
-0,4 |
|
Metals and machinery |
3,1 |
1,7 |
1,9 |
-2,9 |
-3,3 |
0,1 |
|
Electrical machinery |
2,3 |
-1,6 |
3,8 |
-2,1 |
6,4 |
1,8 |
|
Communication and professional equipment |
11,9 |
9,7 |
4,4 |
10,3 |
-4,9 |
6,3 |
|
Transport |
8,0 |
2,1 |
-2,0 |
-0,3 |
3,8 |
2,3 |
|
Other |
1,8 |
0,6 |
-6,8 |
3,2 |
-7,3 |
-1,7 |
|
Total |
2,8 |
2,2 |
1,4 |
0,1 |
0,0 |
1,3 |
* preliminary
The strongest performer during 2011–2015 was communication and professional equipment. Its growth was well above average in all years except for 2015, when it contracted.
The next strongest division, food and beverages, was a relatively consistent performer throughout the period. This division appears less sensitive to the business cycle than other divisions; for example in 2009 (global economic crisis), it was the only division that recorded positive growth (total manufacturing contracted by almost 14% in 2009 whereas food and beverages grew by 2%).
Transport had average growth of 2,3% for the period 2011–2015. This was similar to food and beverages, but the breakdown by year was much more erratic.
Apart from the “other” division, the weakest performer during 2011–2015 was textiles and clothing, which has faced strong competition from Chinese imports.
1 “Industrial production refers to the output of industrial establishments and covers sectors such as mining, manufacturing and public utilities (electricity, gas and water).” Organisation for Economic Co-operation and Development.
2 Visit the archive for the Manufacturing: Production and sales release here.
https://www.statssa.gov.za/?page_id=1866&PPN=P3041.2&SCH=6384
3 South African Reserve Bank Quarterly Bulletin. Visit the SARB website here. http://www.resbank.co.za
Photograph: Volkswagen South Africa, http://www.mediaclubsouthafrica.com/