
Rising food prices: where are the most vulnerable?
A growing number of forecasts reveal that food prices might rise sharply in coming months. Survey data show which parts of the country are most vulnerable.
Current data point to an agriculture industry that is struggling. During November 2015, in the midst of South Africa’s worst drought in 23 years, Stats SA released gross domestic product figures showing three consecutive quarters of steep decline in agricultural activity1. In the third quarter of 2015, the sharp decrease was mainly a result of falling production in field crops, such as maize, sunflowers and sugar cane.
The drought has forced South Africa to import maize to make up the shortfall. With rand weakness driving up the prices of other imports such as wheat2, concern has grown over rising food inflation. Households that depend on grain-based products, and households already struggling to pay for food, are likely to be affected the most.
Who depends the most on grain-based food?
Grain-based food – which includes products made from maize, rice and wheat – account for 4,8% of total spending for the average South African household3. The proportion is much larger for households in rural areas, who spend 10,8% on these staples.
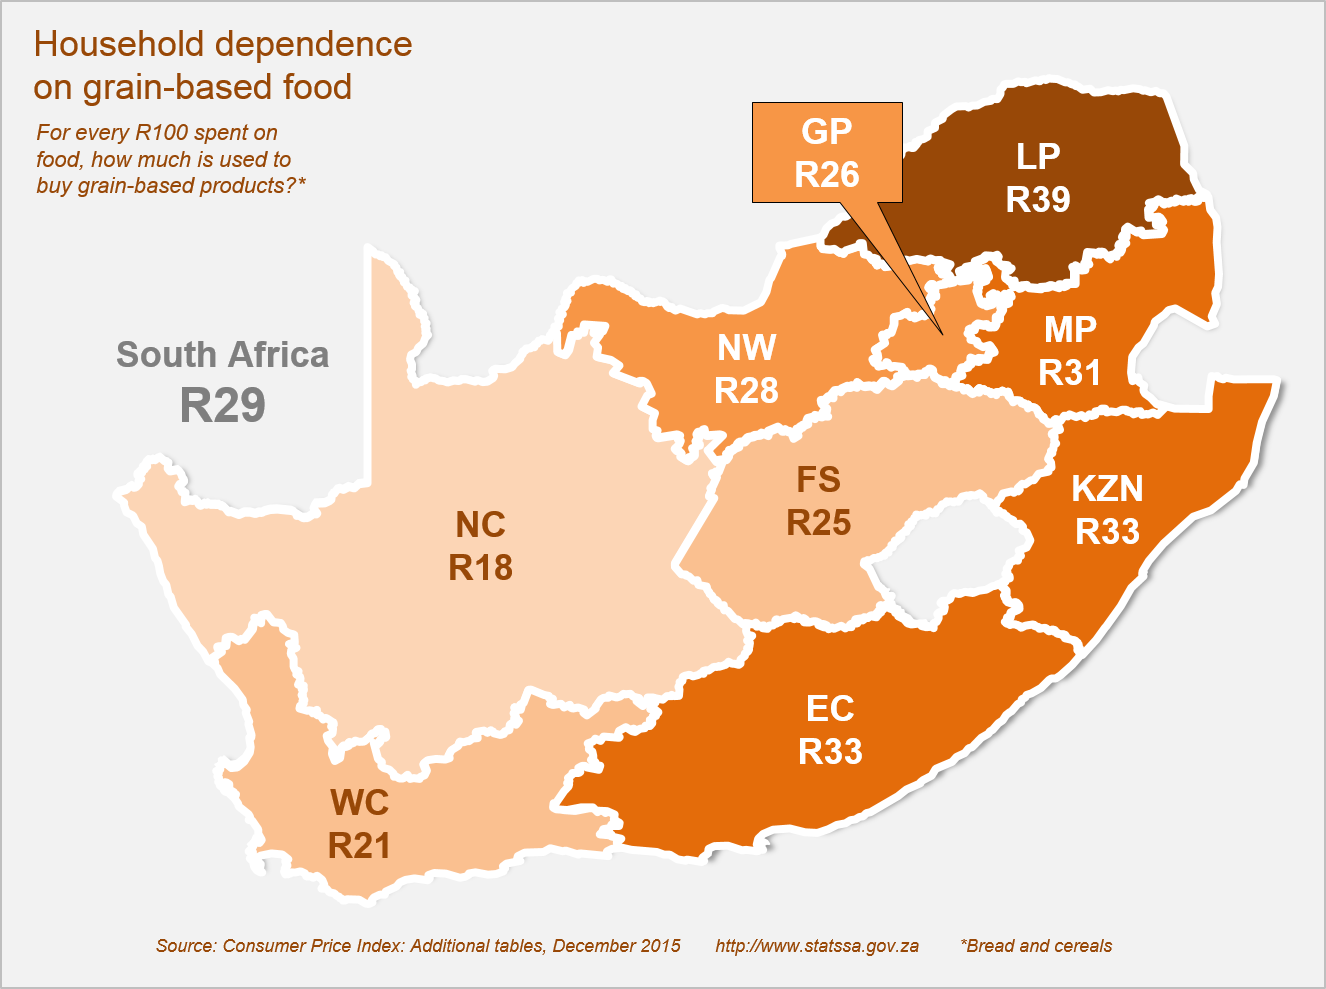
Grain-based products account for over one-third of the food budget for households in rural areas. For every R100 spent on food, households in rural areas spend R37 on grain-based products. Households in primary urban areas spend R25.
A provincial breakdown, which includes both urban and rural households, shows Limpopo being most affected. For every R100 spent on food, households in the province spend an average of R39 on grain-based products, followed by Eastern Cape (R33), KwaZulu-Natal (R33), Mpumalanga (R31) and North West (R28).
Who struggles the most to buy food?
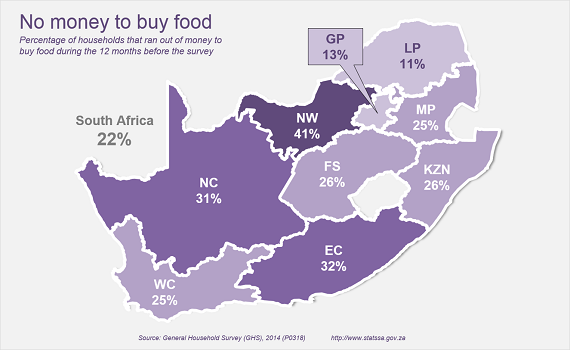
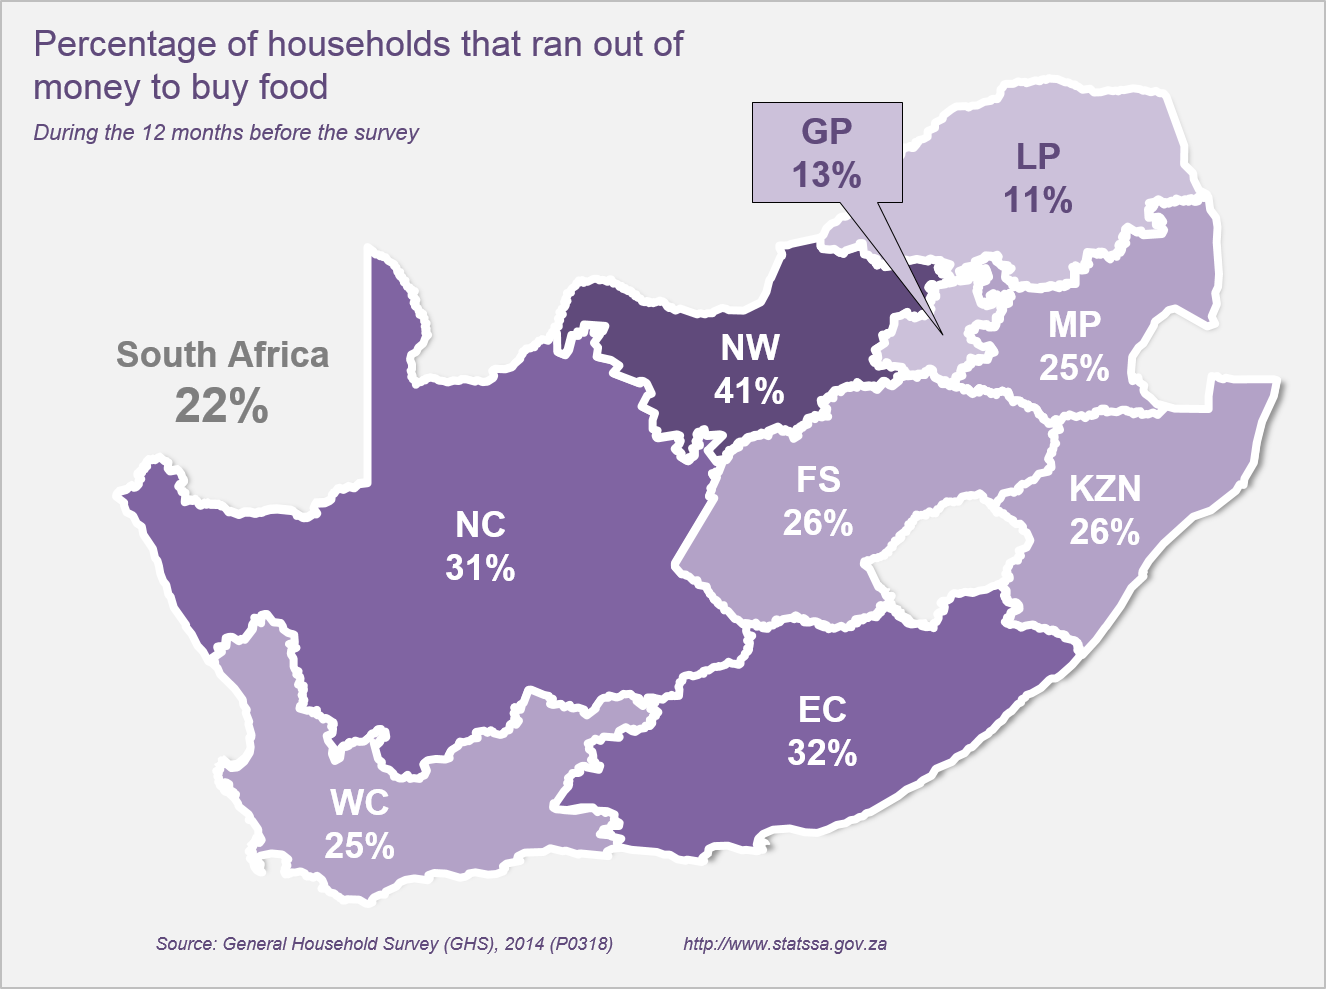
North West and Eastern Cape are again flagged in more recent data from the General Household Survey, related to households’ ability to buy food.
The data show that 22% of households in the country ran out of money to buy food some time during the 12 months prior to the survey4. The problem is particularly severe in North West (41%), Eastern Cape (32%) and Northern Cape (31%).
How are prices behaving at the moment?
It might come as a surprise to learn that inflation for grain-based foods actually slowed in 2015. The prices that consumers pay for grain-based foods increased by an average of 5,1% in 2015, which is lower than the 7,5% increase recorded for 20145. However, a closer look at the monthly data shows that the annual rate picked up from 2,4% in April 2015 to 7,5% in December.
Equally concerning are price trends at producer level. Prices charged by producers for cereals and other crops have risen sharply, according to Stats SA’s Producer Price Index release6. Prices increased by an average of 19,7% in 2015, which is far higher than the 3,5% rise recorded for 2014. Recent figures place inflation for cereals and other crops at 53,7% year-on-year for December 2015. These developments do not bode well for consumers.
1 Download the gross domestic product (GDP) release here.
2 http://ewn.co.za/2015/12/17/Grain-SA-warns-of-further-increases-in-maize-wheat-prices
3 Weights published in Consumer Price Index: Additional tables, December 2015. Grain-based products are classified as “bread and cereals”. Download the document here.
4 Data extracted from General Household Survey 2014 Nesstar dataset. For more comprehensive statistics on vulnerability to hunger and access to food, download the release here.
5 Visit the Consumer Price Index (CPI) archive here.
6 Visit the Producer Price Index (PPI) archive here.