
Private sector turnover rises in the third quarter
Stats SA’s latest Quarterly Financial Statistics report provides detailed financial statistics on the private sector, for the quarter ending September 2015. How did business turnover fare over this period? The following short article covers key turnover statistics from the report.
Total turnover
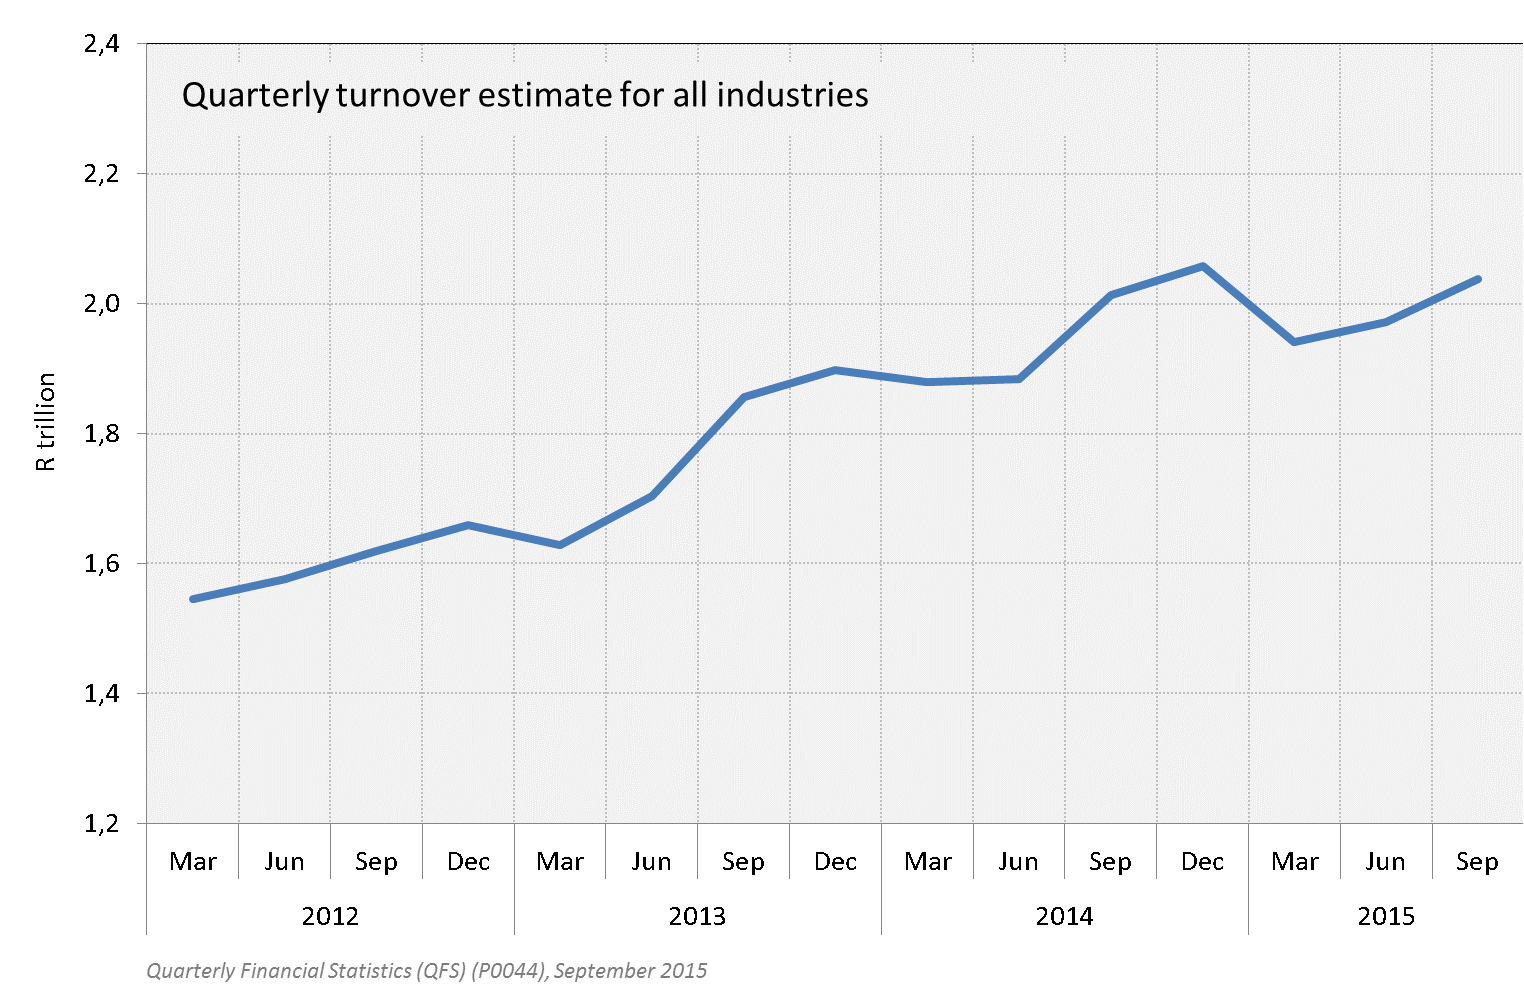
Total turnover in the private sector increased by 3,3% in the September 2015 quarter compared with the June 2015 quarter, rising from an estimated R1,97 trillion to R2,04 trillion. This is the highest quarter-on-quarter percentage increase since the September 2014 quarter. However, quarterly changes are heavily influenced by seasonal factors that can affect the interpretation of data and distort analysis of turnover ratios. For example, the fourth quarter (October–December) tends to have high turnover because of festive season trade and manufacturing production in anticipation of the festive season.
This is not the first time that total turnover has broken the R2 trillion mark. Turnover rose to above R2 trillion in the September and December 2014 quarters, after which it decreased to R1,94 trillion in the March 2015 quarter.
Turnover by industry
Just over a third of total turnover in the September 2015 quarter was earned by the trade industry, followed by manufacturing (28%), business services (12%), transport (9%) and mining (6%)1.
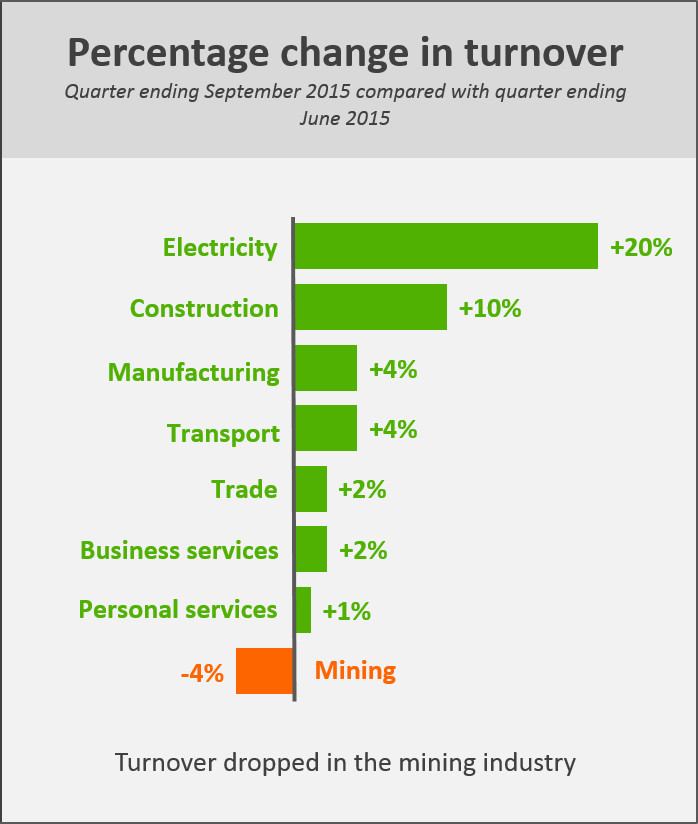
Turnover increased in seven of the eight industries between the June and September 2015 quarters. The largest percentage increase was recorded in the electricity, gas and water supply industry (+20%) (mostly seasonal), followed by construction (+10%) and manufacturing (+4%). Turnover decreased by 4% in the mining industry over the same period.
Turnover by enterprise size
Broken down by enterprise size, large enterprises contributed 64% to total turnover in the September 2015 quarter, followed by small (27%) and medium enterprises (9%).
An interesting pattern emerges if turnover is plotted over time for these three size groups. The chart below shows the amount of turnover earned per quarter. To make meaningful comparisons, the figures for the March 2012 quarter have been set to an index of 100.
During 2014 and most of 2015, the turnover of large and medium enterprises was relatively flat. Over the same period, small enterprises saw a substantial increase in turnover (around 19%). This illustrates a general point in conducting analysis, namely that totals can often hide interesting patterns in components. For example, the manufacturing industry has many components, whose behaviour may be quite different from that of the total over any given time period.
Download the release here.
1Note that the figures in the report exclude agriculture, hunting, forestry and fishing, and financial intermediation and insurance and government institutions.
Stats SA’s Quarterly Financial Statistics Survey provides financial information on private-sector enterprises in terms of income and expenditure items, inventories, capital expenditure, the carrying value of assets and selected operating financial ratios. These estimates are used by the private sector for various purposes, including that of comparative business and industry performance analyses.