
Hotel occupancy falls, but income from accommodation is up
Hotel occupancy fell to 48,2% in June 2015, according to preliminary figures in Stats SA’s latest Tourist accommodation release.
The hotel occupancy rate followed a seasonal pattern by falling in June after peaking in both October (62,4%) and February (60,6%)1. However, hotels had proportionally fewer rooms filled in June compared with the same month in previous years. The June 2015 rate was lower than those recorded for June 2014 (49,8%), June 2013 (50,3%) and June 2012 (49,7%).
Over the last four years hotels have experienced relatively high occupancy rates during peak months (October/November and February/March), often surpassing the 59,4% recorded during the 2010 Soccer World Cup. However, the rate recorded for June 2015 was the lowest since January 2012.
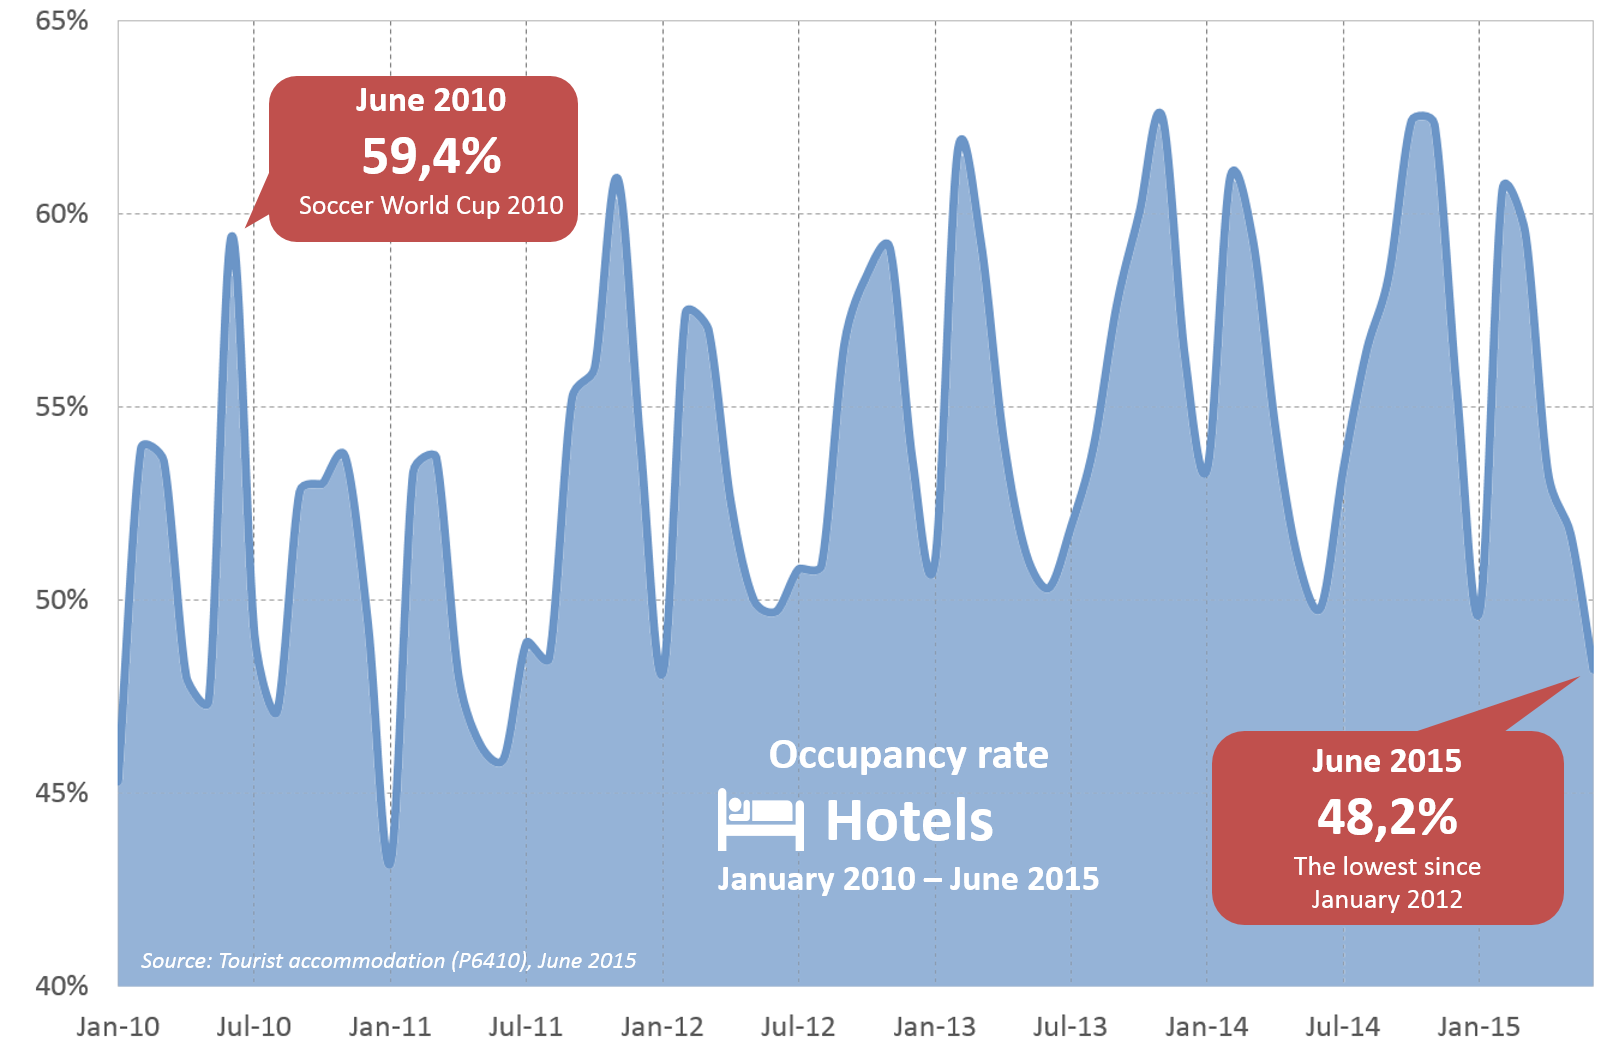
The number of stay unit nights sold2 by hotels totalled 869 600 in June, 3,2% lower than the number sold in June 2014, and 3,8% lower than the number sold in June 2013.
In fact, hotels experienced less activity in the first half of 2015 compared with previous years. 5,85 million stay unit nights were sold from January to June. This is 1,7% lower than the number sold in the same period in 2014, and 0,7% lower than in 2013.
What could be contributing to the slight downturn? According to Stats SA’s Tourism Satellite Account for South Africa report, 42% of money spent on accommodation in 2013 was from the pockets of international visitors3. So any change in the number of tourists, who can afford (and who choose) to stay in hotels, is bound to affect accommodation figures.
There has been a drop in the number of international tourists. Data from Stats SA’s Tourism and migration release show that in the first quarter of 2015, 2,29 million international tourists (from both overseas and Africa) graced our shores. This is 5,9% lower than the 2,43 million who visited in the first quarter of 20144.
The number of overseas tourists also decreased by 6,8% in the first quarter of 2015 compared with the first quarter of 2014, dropping from 632 642 to 589 802.
The chart below shows seasonal similarities between the number of overseas tourists and the amount of income earned by hotels from accommodation. Overseas tourist figures are not yet available for May and June 2015.
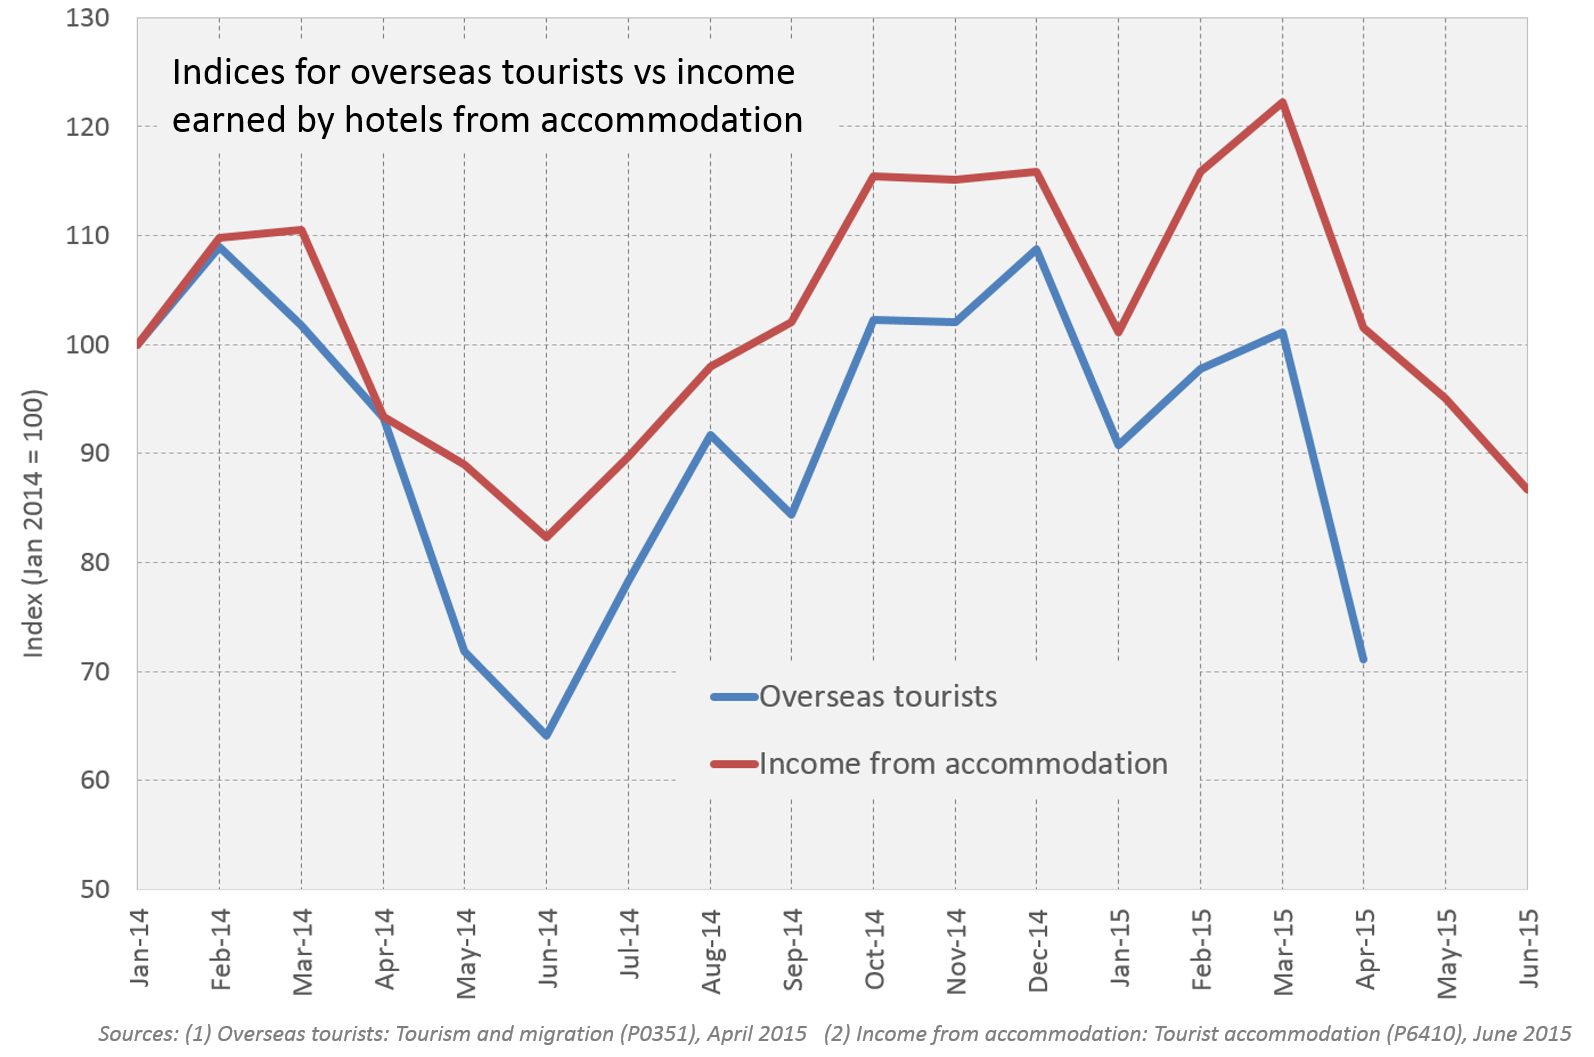
Interestingly, hotels are earning more income, despite a drop in occupancy rates and the number of stay unit nights sold. Income from accommodation was up 5,4% year-on-year in June. It was also up 6,4% in the first six months of 2015 compared with the same period in 20141.
This could be due to an overall increase in the price of rooms. It could also be due to seasonal changes in the demand for particular types of stay unit nights sold. For example, hotels might be filling higher priced suites that bring in additional money per room.
1 Download the Tourist accommodation release here.
2 A stay unit is the unit of accommodation available to be charged out to guests, for example, a room in a hotel. Stay unit nights sold is the total number of stay units occupied on each night during the survey period.
3 Download the Tourism Satellite Account for South Africa report here.
4 Download the latest Tourism and migration release here.