
The importance of tracking prices: the case of petrol
Changing fuel prices affect us all. With the recent downward trend in prices seemingly coming to an end, South Africans are again left wondering how the petrol price will affect their pockets. Consumer inflation data released today1 provide an indication of the impact that the recent period of low petrol prices had on the cost of living.
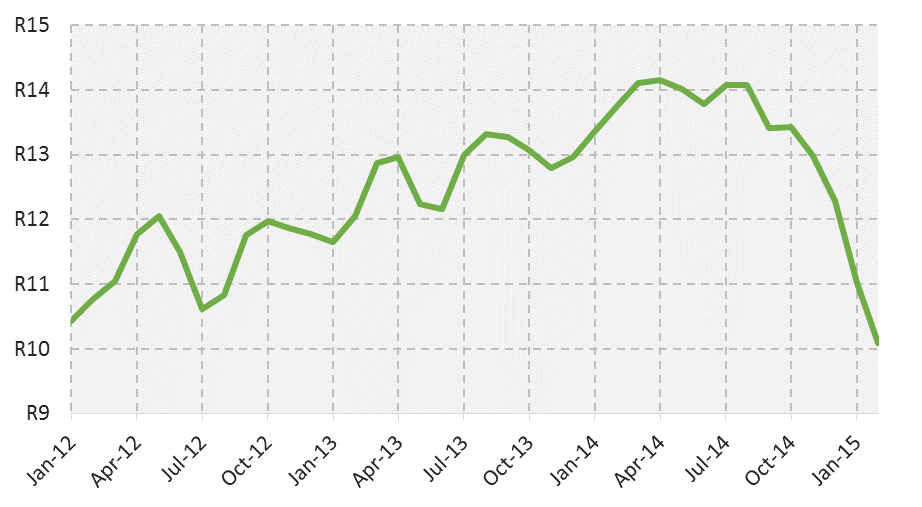
The petrol price started falling after April 2014. Filling a 45 litre tank during that month would have set you back R637, with the price of inland 93 octane petrol at R14,16 per litre (Figure 1)2. There was some respite in the following months, with the price settling to R13,43 per litre in October 2014.
Petrol prices then fell sharply. Relieved motorists found themselves paying almost 25% less for fuel in February 2015 than they did in October the previous year. Filling a 45 litre tank in February 2015 would have cost R454, with the petrol price at R10,09 per litre.
Figure 1: The per litre price of inland 93 octane
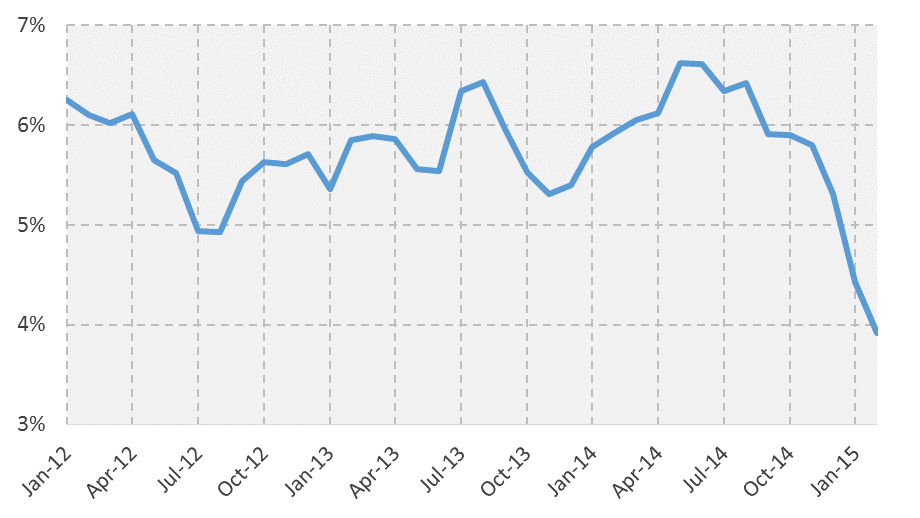
The fall in the petrol price was bound to have an effect on the cost of living. Overall consumer inflation, as measured by the consumer price index (CPI), decreased over the same period, from 5,9% in October 2014 to 3,9% in February 2015 (Figure 2).
Figure 2: Headline CPI annual rate of change
It might be tempting to think that the fall in overall inflation was purely a result of decreasing fuel prices, but this conclusion can’t be drawn by simply comparing Figures 1 and 2. The overall CPI figure reflects the average price level for a range of goods and services, so the real impact of the fuel price will always be clouded by fluctuations in the prices of other items, such as food and education.
Stats SA publishes a set of inflation figures that teases out the impact that specific goods and services have on inflation, referred to as analytical series (see Table A in the CPI statistical release). Figure 3 compares overall CPI inflation, represented by the blue line, with what CPI inflation would have been if the direct influence of petrol is removed, represented by the orange line. Overall CPI inflation fell from 5,9% in October 2014 to 3,9% in February 2015. CPI excluding petrol remained stable in comparison, at 6,0% for both months.
Figure 3: Headline CPI compared with CPI excluding petrol (annual rate of change)

What this means is that the rate of change in the prices for all goods and services, excluding petrol, remained stable. The main contributor to the fall in overall CPI inflation was indeed the petrol price.
Looking beyond February, we know that the petrol price increased in March, and it remains to be seen what it does in April and following months. If one considers Figure 3 above, any sharp increases in the petrol price are bound to place significant upward pressure on overall inflation.
Download the complete CPI statistical release here.
2 Petrol prices are available from the Department of Energy (click here).
Photo: Sasol click here