
QUARTERLY LABOUR FORCE SURVEY: Quarter 1(January to March), 2014
Stats SA today released the Q1:2014 results which show a quarterly decline in employment by 122 000 due to a loss of 110 000 jobs in the informal sector.
Formal sector employment was virtually unchanged at 10,8 million compared with the previous quarter, while both Private households and Agriculture shed jobs (14 000 and 5 000 respectively).
The decrease in employment over the period Q4:2013 and Q1:2014, was accompanied by an increase in unemployment (up 237 000) resulting in a 1,1 percentage point increase in the unemployment rate to 25,2%.
Over the same period, the absorption rate decreased by 0,5 of a percentage point to 42,8% and the number of discouraged work-seekers increased by 154 000.
Table A: Key labour market indicators
|
Jan-Mar 2013 |
Oct-Dec 2013 |
Jan-Mar 2014 |
Qtr-to-qtr change |
Yr-on-yr change |
Qtr-to-qtr change |
Yr-on-yr change |
|
|
Thousand |
Per cent |
||||||
| Population aged 15–64 yrs |
34 558 |
35 022 |
35 177 |
155 |
619 |
0,4 |
1,8 |
| Labour force |
19 420 |
20 007 |
20 122 |
115 |
701 |
0,6 |
3,6 |
| Employed |
14 558 |
15 177 |
15 055 |
-122 |
496 |
-0,8 |
3,4 |
| Formal sector (non-agricultural) |
10 242 |
10 773 |
10 780 |
7 |
538 |
0,1 |
5,3 |
| Informal sector (non-agricultural) |
2 334 |
2 446 |
2 336 |
-110 |
2 |
-4,5 |
0,1 |
| Agriculture |
764 |
713 |
709 |
-5 |
-55 |
-0,7 |
-7,2 |
| Private households |
1 219 |
1 244 |
1 231 |
-14 |
12 |
-1,1 |
0,9 |
| Unemployed |
4 862 |
4 830 |
5 067 |
237 |
205 |
4,9 |
4,2 |
| Not economically active |
15 138 |
15 015 |
15 055 |
40 |
-83 |
0,3 |
-0,5 |
| Discouraged job-seekers |
2 401 |
2 200 |
2 355 |
154 |
-46 |
7,0 |
-1,9 |
| Other (not economically active) |
12 737 |
12 815 |
12 700 |
-114 |
-37 |
-0,9 |
-0,3 |
| Rates (%) |
|
|
|
|
|
|
|
| Unemployment rate |
25,0 |
24,1 |
25,2 |
1,1 |
0,2 |
|
|
| Employment/population ratio
(absorption rate) |
42,1 |
43,3 |
42,8 |
-0,5 |
0,7 |
|
|
| Labour force participation rate |
56,2 |
57,1 |
57,2 |
0,1 |
1,0 |
|
|
Year-on-year figures show that both employment and unemployment rose – by 496 000 and 205 000 respectively. As a result, the unemployment rate increased by 0,2 of a percentage point, while the absorption rate and labour force participation rate increased by 0,7 and 1,0 percentage points respectively.
Figure 1: Employment by Industry
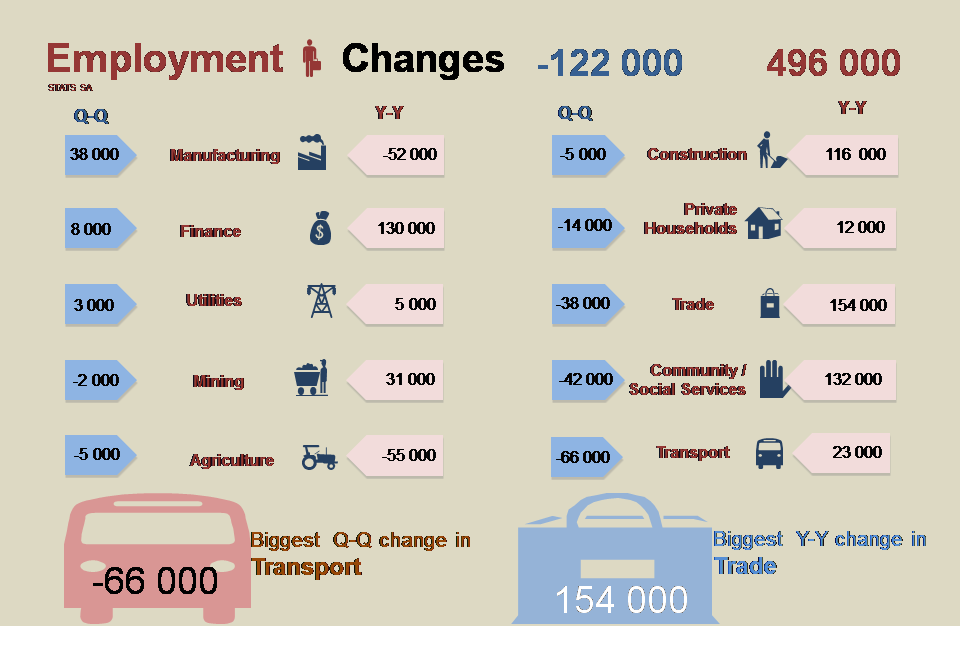
The contraction in employment between Q4:2013 and Q1:2014 was driven mainly by a decrease in employment in Transport, storage and communication (66 000), Community and social services (42 000) and Trade (38 000) industries.
Although employment decreased quarter-to-quarter, it increased by 496 000 compared to the same period last year. The industries that contributed most to the year-on-year increase were: Trade (154 000), Community and social services (132 000), Finance and other business services (130 000) and Construction (116 000).
Figure 2: Employment levels and absorption rates
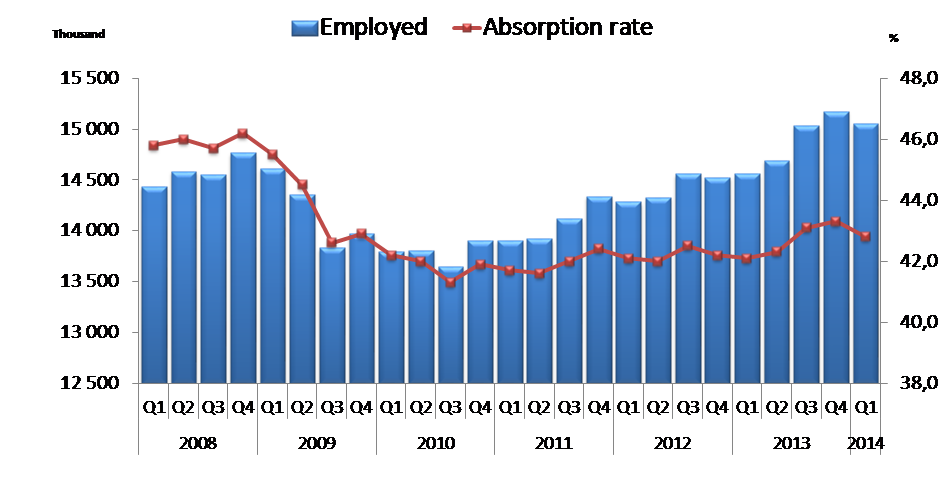
Employment has recovered to levels observed before the recession. However, in Q1: 2014, the proportion of those employed among the working age population at 42,8% is still lower than before the recession occurred (46,2% in Q4: 2008).
Youth continue to be vulnerable in the labour market. Although their level of educational attainment has improved over the period 2008 to 2014, their labour market situation deteriorated markedly during the recession. In Q1: 2014, the unemployment rate among young people aged 15-34 years was 36,1% which is 3,4 percentage points higher than in Q1: 2008. Young people who are employed are more likely to be employed in precarious conditions; for example 20,7% of employed youth are on contracts of a limited duration compared to 10,8% of employed adults.
For media enquiries contact:
Ms Kefiloe Masiteng
Deputy Director General: Population and Social Statistics, on (012) 310 2109
For technical enquiries contact:
Mr Peter Buwembo
Executive Manager: Labour Statistics, on (012) 310 8655