
Agricultural households at municipality level: The case of Buffalo City vs. Mangaung
The 2011 population census included a set of questions designed to gather information about households that are involved in some form of agricultural activity. These results were made available on a provincial basis on 31 March 2014. Stats SA can now disseminate the information on a municipal level as well. To illustrate its use, the primary variables are compared between two large municipalities, one inland and the other coastal.
In 2011, Buffalo City Municipality (BCM) and Mangaung Municipality (MM) had populations of 223 568 and 231 921 households respectively. The census results showed that out of these populations, 43 264 or 19,4% (BCM) and 46 172 or 19,9% (MM) of the households were involved in agricultural activity.
Distribution of agricultural households by type of activity
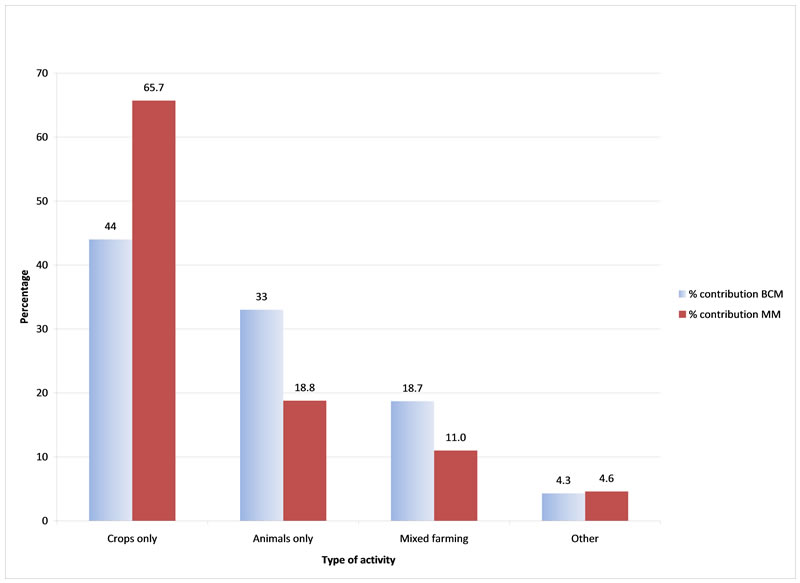
Figure 1 shows striking similarities and differences between the two municipalities. “Crops only” was the dominant agricultural activity in both municipalities, followed by (in both) “animals only”, “mixed farming” and “other”. And yet the differences between the municipalities are equally stark, with “crops only” accounting for 65,7% of activity in MM but only 44,0% in BCM; correspondingly, “animals only” and “mixed farming” were more prevalent in BCM than in MM.
Figure 1 – Percentage distribution of agricultural households by type of activity
Distribution of agricultural household heads by annual income
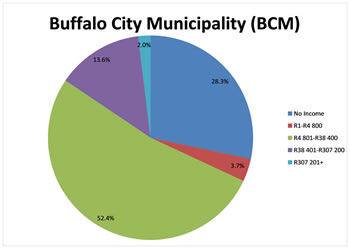
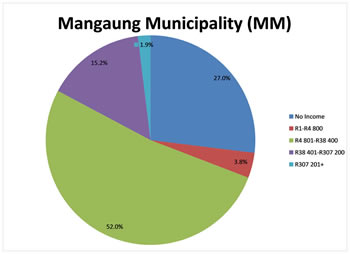
The majority of agricultural household heads in BCM (22 426 or 51,4%) and MM (23 693 or 51,3%) earned their living from an annual income bracket between R4 801 – R38 400. The proportion of ‘no income’ for the agricultural household head in each municipality showed that there was only a slight difference between the two municipalities. The BCM recorded 12 093 (27,7%) and MM recorded 12 289 (26,6%) agricultural household heads with no income. Furthermore, the agricultural household heads that earned more than R307 201 per annum also showed no significant difference: 856 (2,0%) in BCM compared with 882 (1,9%) in MM. This showed that the household heads involved in agricultural activity within the two municipalities had similar income profiles.
Figure 2.1 – Percentage distribution of agricultural households head annual income
Distribution of agricultural households by specific activity
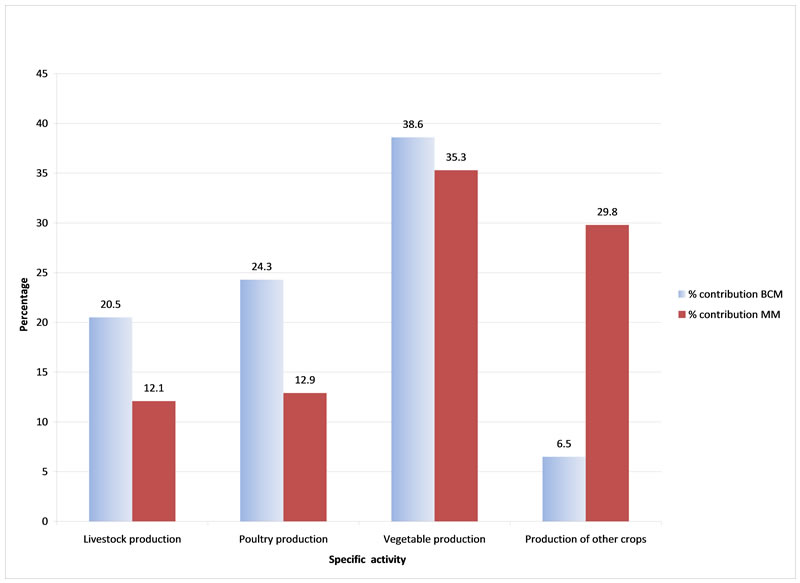
The population census also provided information on specific agricultural activities, namely livestock production, poultry production, vegetable production, production of “other crops”, and other (e.g. bee and aquaculture). Measured as a percentage of the total of specific activities, vegetable production dominated in both BCM (38,6%) and MM (35,3%). In MM “other crop production” (which is mainly field crops) was a close second (29,8%), whereas in BCM it was only 6,5%, clearly reflecting the impact of climate and weather conditions. Within BCM and MM, livestock production and poultry production were at similar levels, namely 20,5% (livestock) and 24,3% (poultry) in BCM; and 12,1% (livestock) and 13,0% (poultry) in MM.
Figure 3 – Percentage distribution of agricultural households by specific activity
Click here for more Argircultural households information on municipality level