
Bucket toilets decline but use remains above pre-pandemic lows
Bucket toilets remain the thorn in the flesh of several municipalities. Despite an overall decline in the use of municipal bucket toilets in 2023, some municipalities recorded an increase.
The municipal provision of bucket toilets
Service delivery can be measured from two different angles. The first is to approach the demand side, by collecting and analysing service-related data from households. Examples include Stats SA’s population census and annual General Household Survey.
The second is to measure service delivery from the supply side. Stats SA’s annual Non-financial census of municipalities survey does this by asking municipalities for data on the number of households or consumer units1 that they service.
In this context, bucket toilets are provided by municipalities to communities, often as a short-term option until permanent sanitation solutions are in place. However, challenges often derail the development of more sustainable alternatives, making it difficult to replace bucket toilets once they are introduced.
Where are the bucket toilets?
In 2023, 37 municipalities out of 257 provided bucket toilets as a service (Figure 1). These are located across five provinces: 13 municipalities were in Free State, 12 in Northern Cape, 7 in Eastern Cape, 3 in North West and 2 in Western Cape. This leaves Gauteng, KwaZulu-Natal, Limpopo and Mpumalanga without bucket toilet services.
Free State had the highest number of households using a bucket toilet, accounting for almost half of the national total.
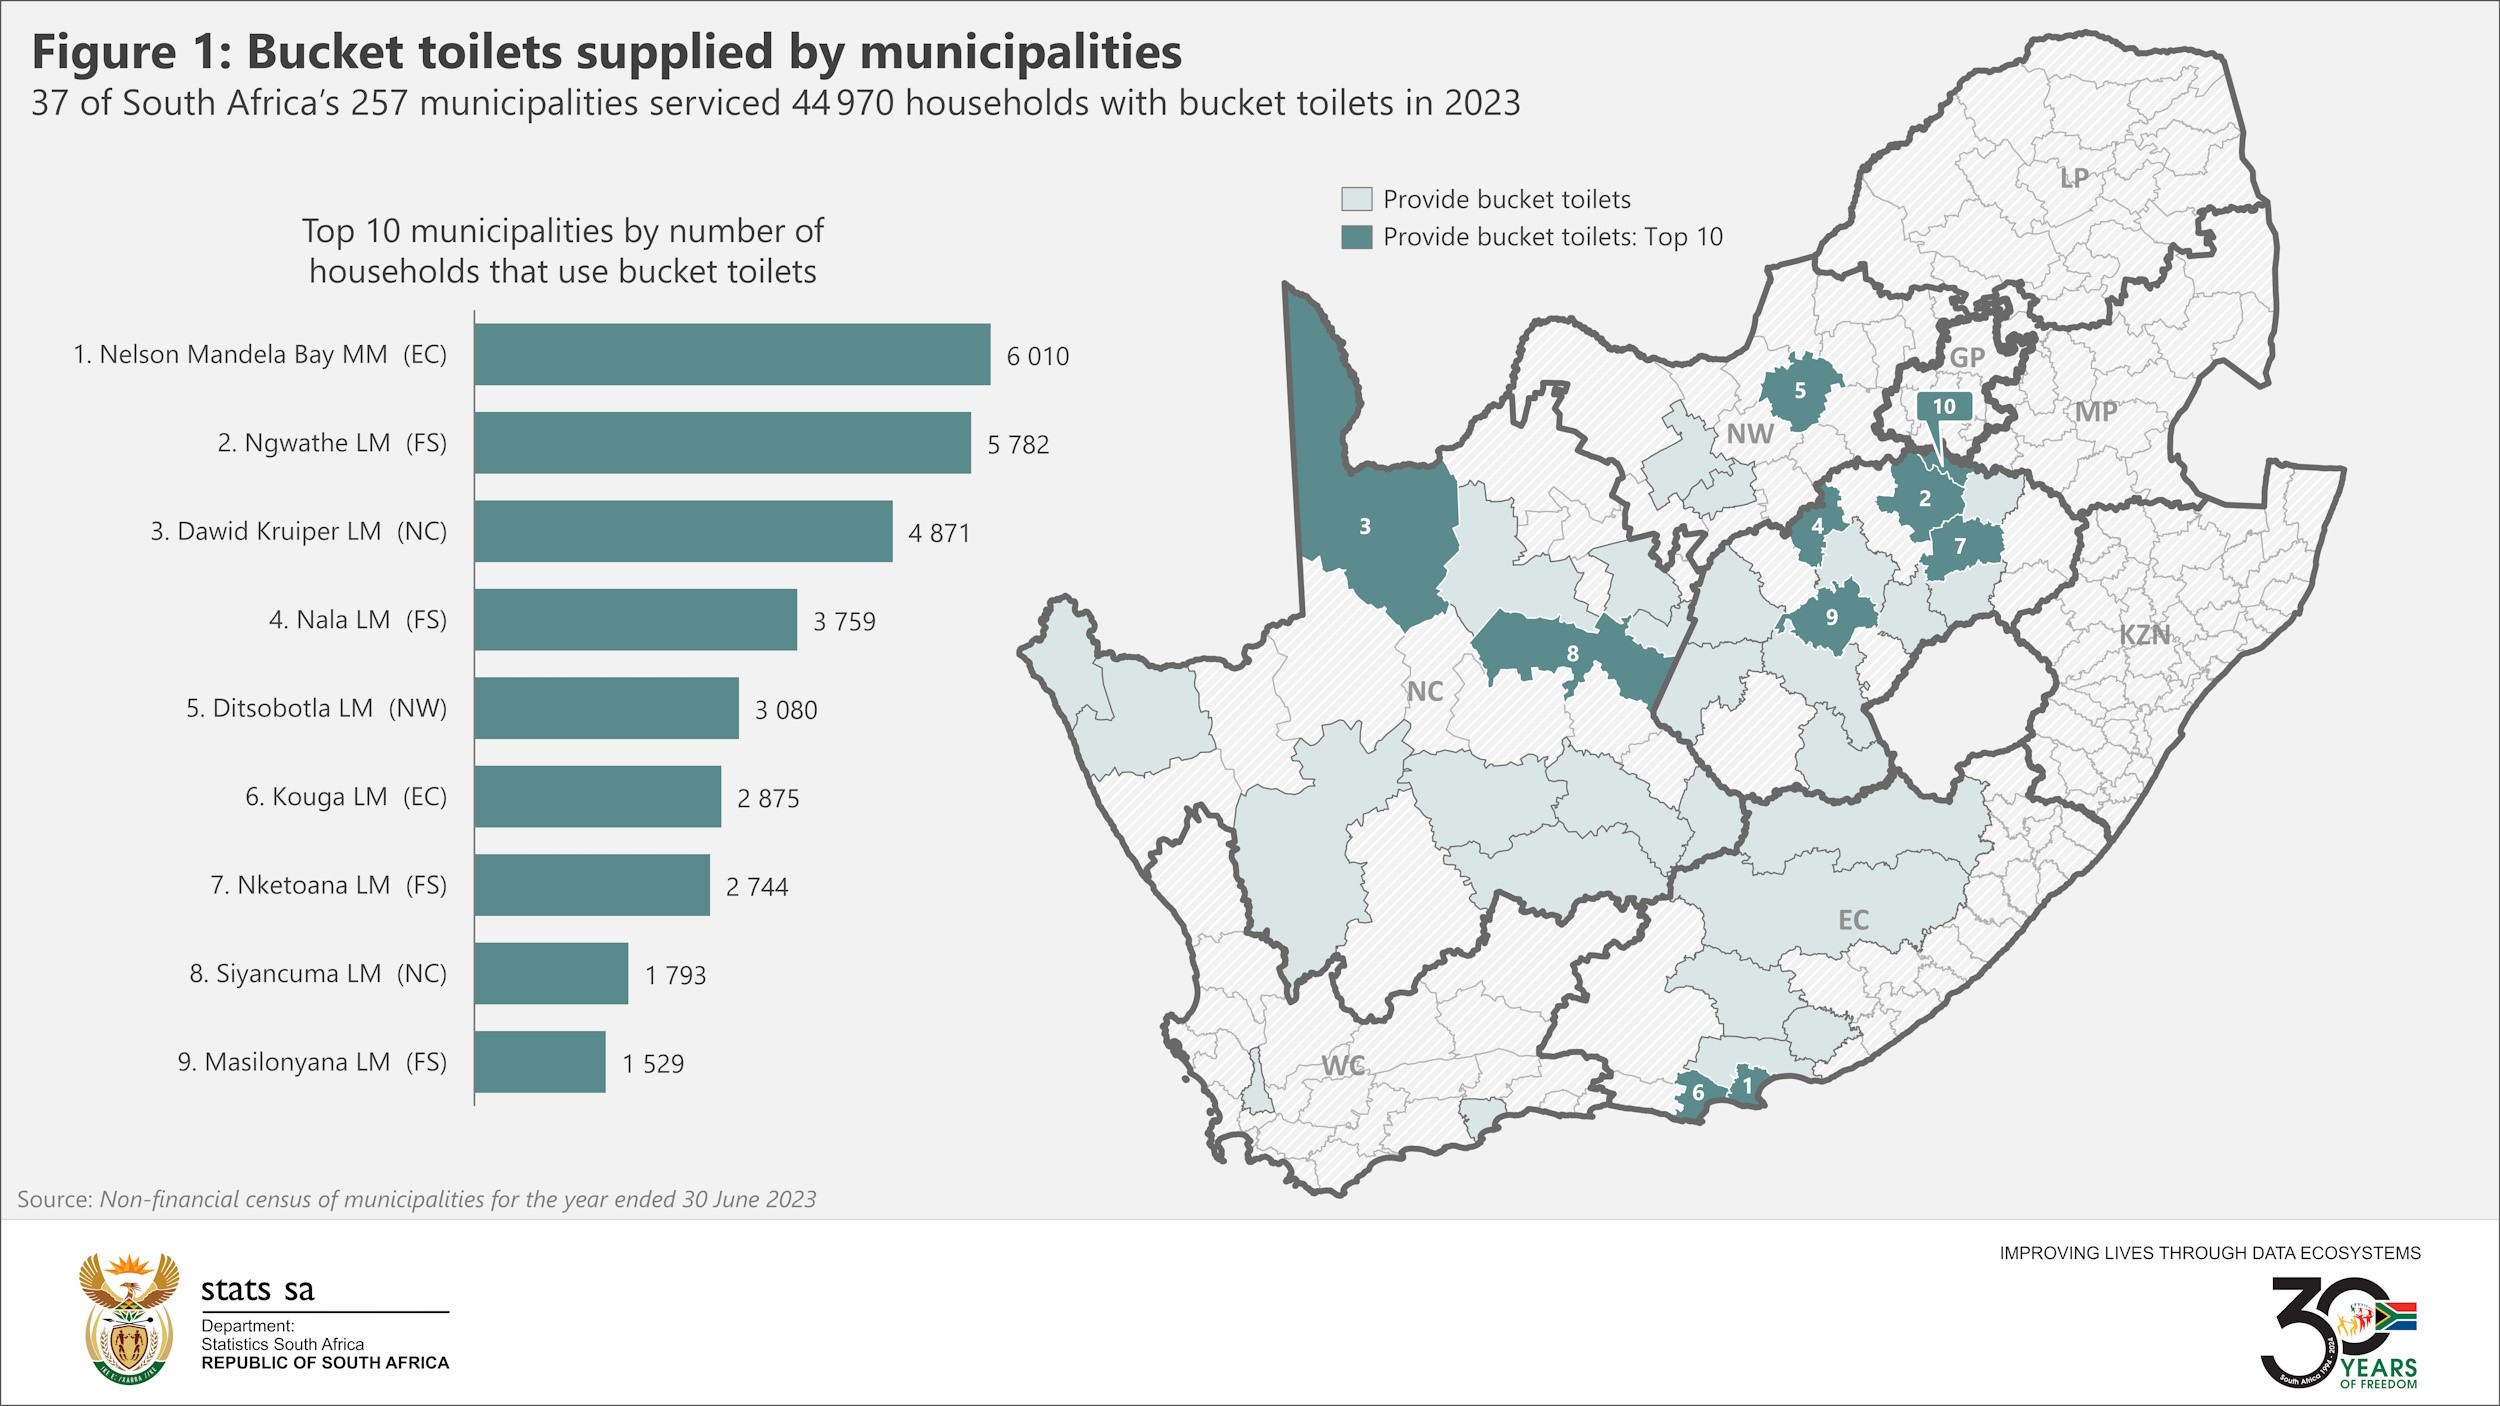
A closer look at the data shows which municipalities bear the biggest burden. Nelson Mandela Bay Metropolitan Municipality serviced the highest number of bucket toilets in 2023. Despite its position on top of the list, the city has cut down on bucket toilet use over the last decade. In 2013, Nelson Mandela Bay Metropolitan Municipality serviced 30 202 households with this type of sanitation,2 reducing the number to 6 010 in 2023.
Bucket toilet prevalence above pre-pandemic lows
The decline recorded by Nelson Mandela Bay Metropolitan Municipality follows a general national trend. Municipalities nationwide recorded a peak of 100 618 households using the service in 2013. From this point municipalities made progress, reducing the number to a low of 42 434 in 2019 (Figure 2).
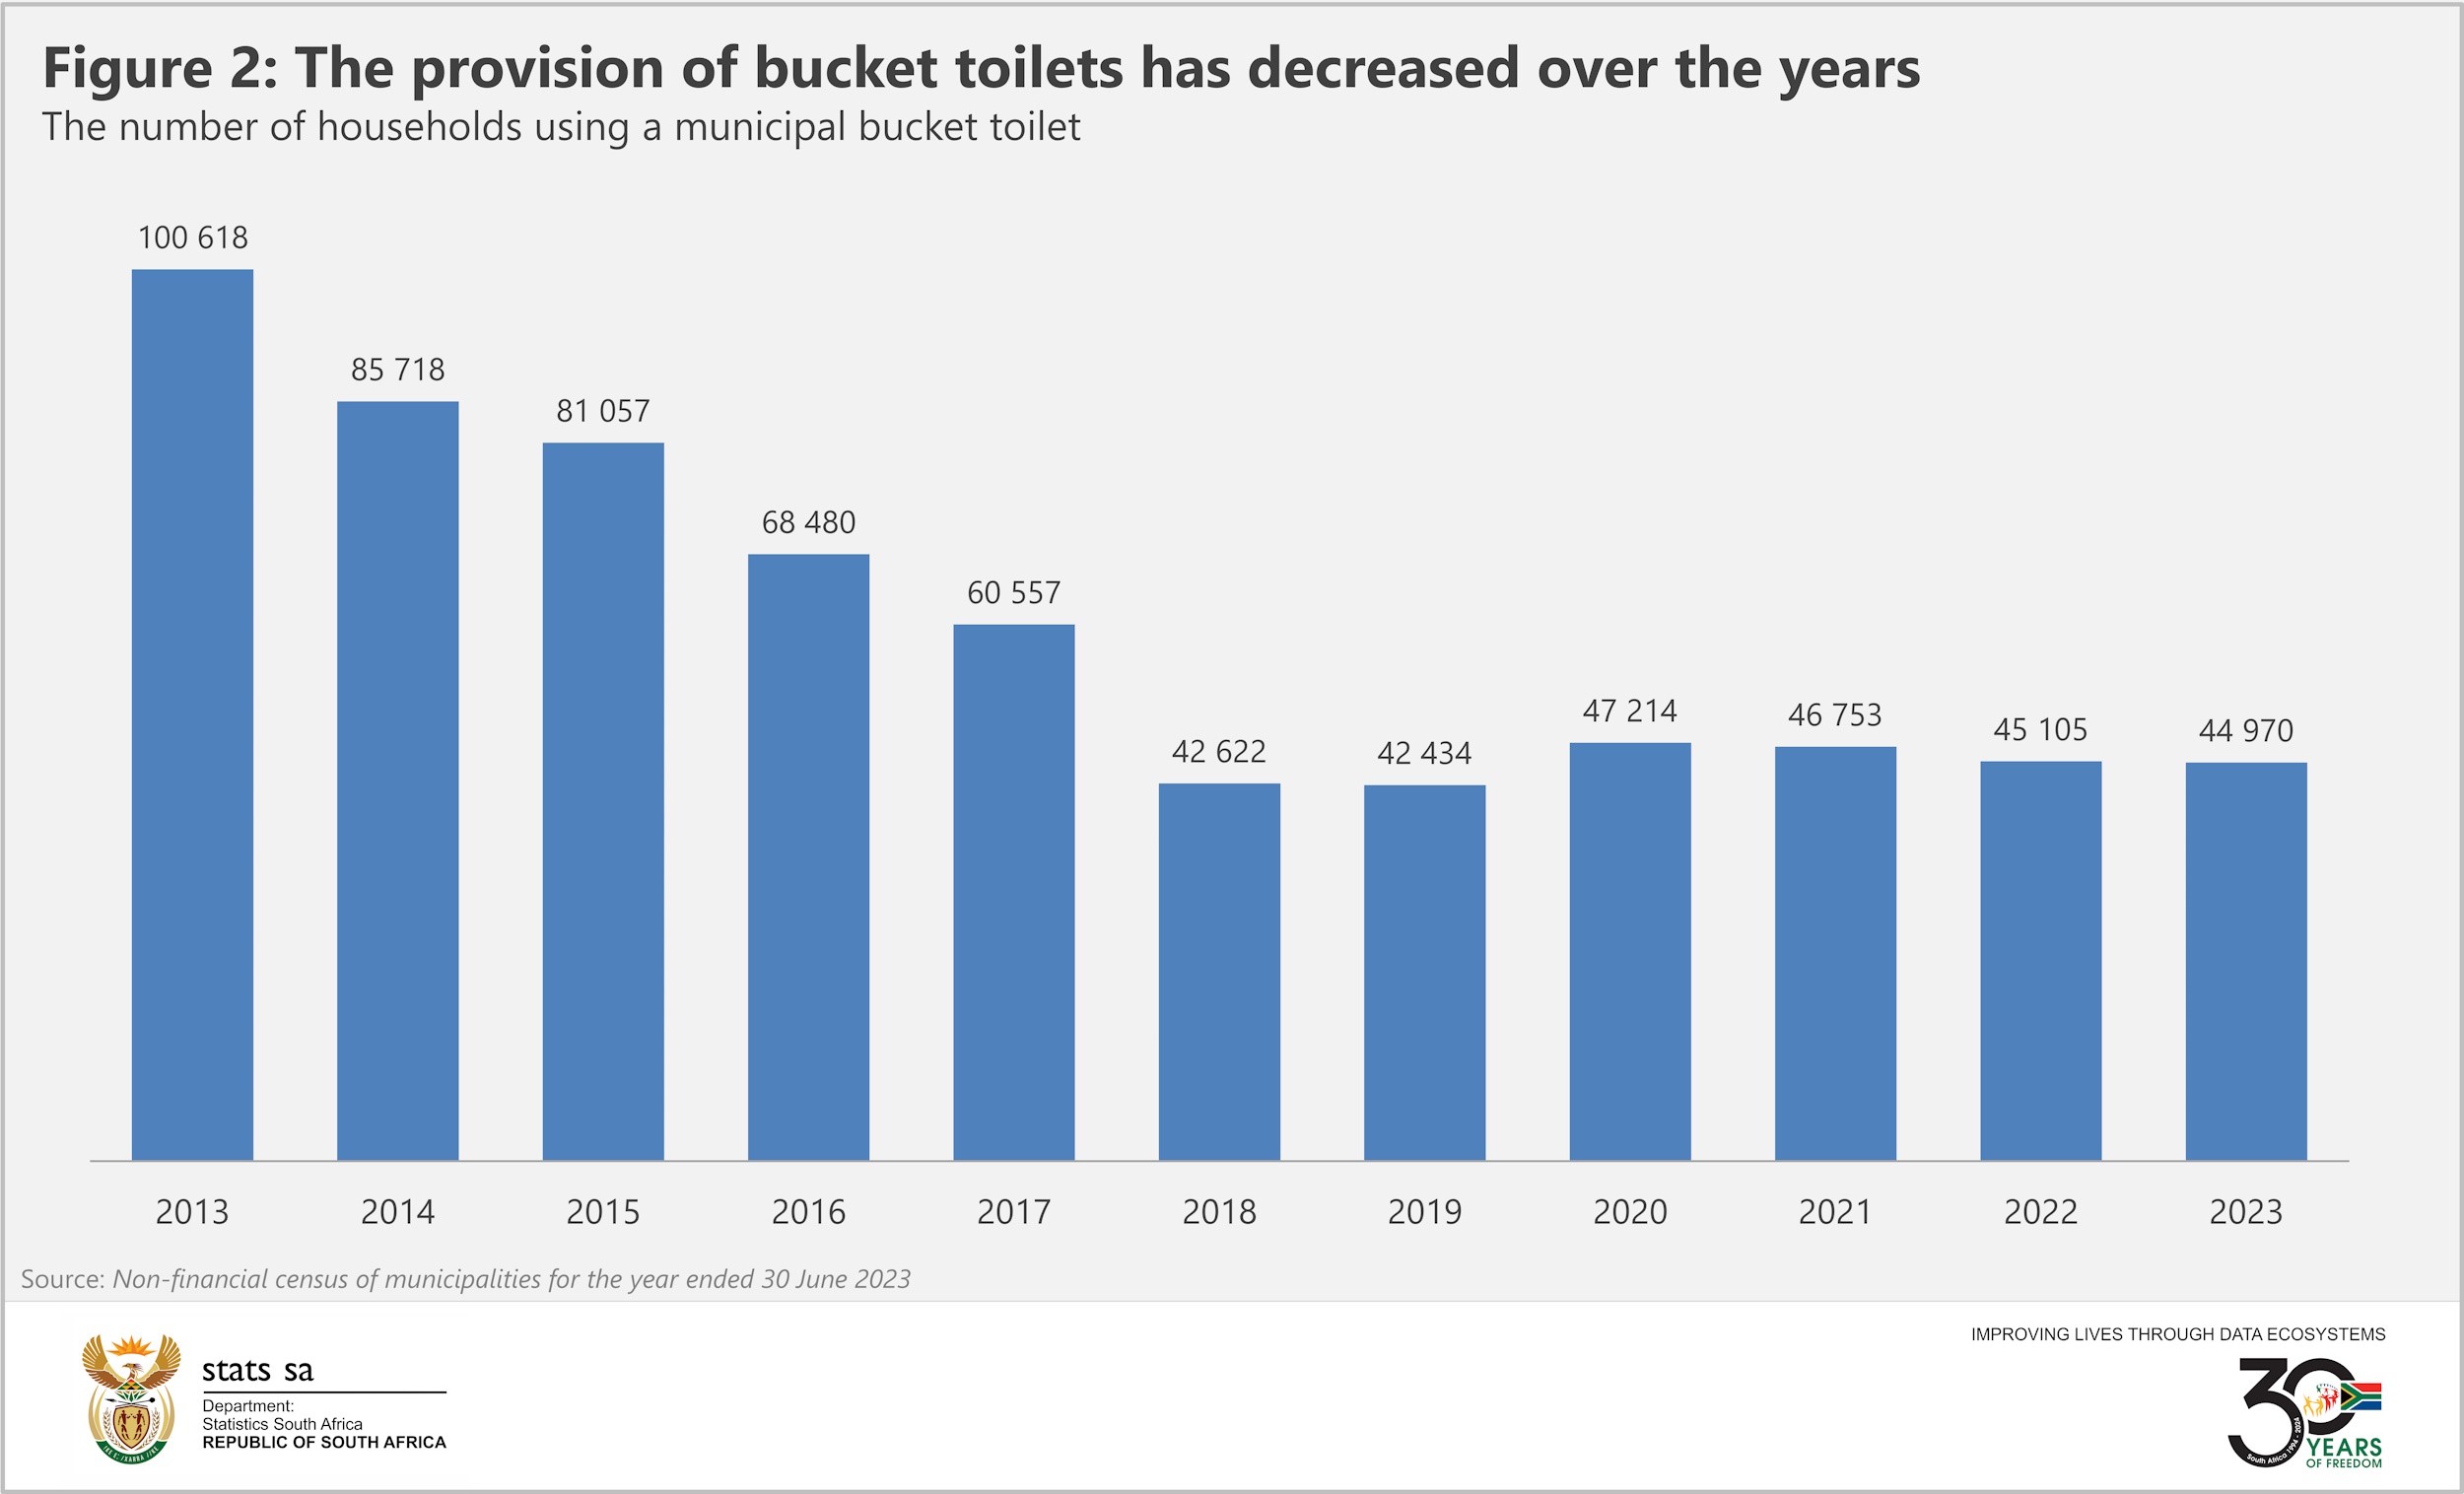
The pandemic threw a spanner in the works. Bucket toilet prevalence climbed to 47 214 households in 2020 but reduced to 45 105 in 2022. The number edged lower to 44 970 in 2023, still above pre-pandemic lows.
Five municipalities managed to cut down on bucket toilet use in 2023 compared with 2022, with Mafube Local Municipality making the biggest positive impact (Figure 3). Two other municipalities in Free State also recorded declines.
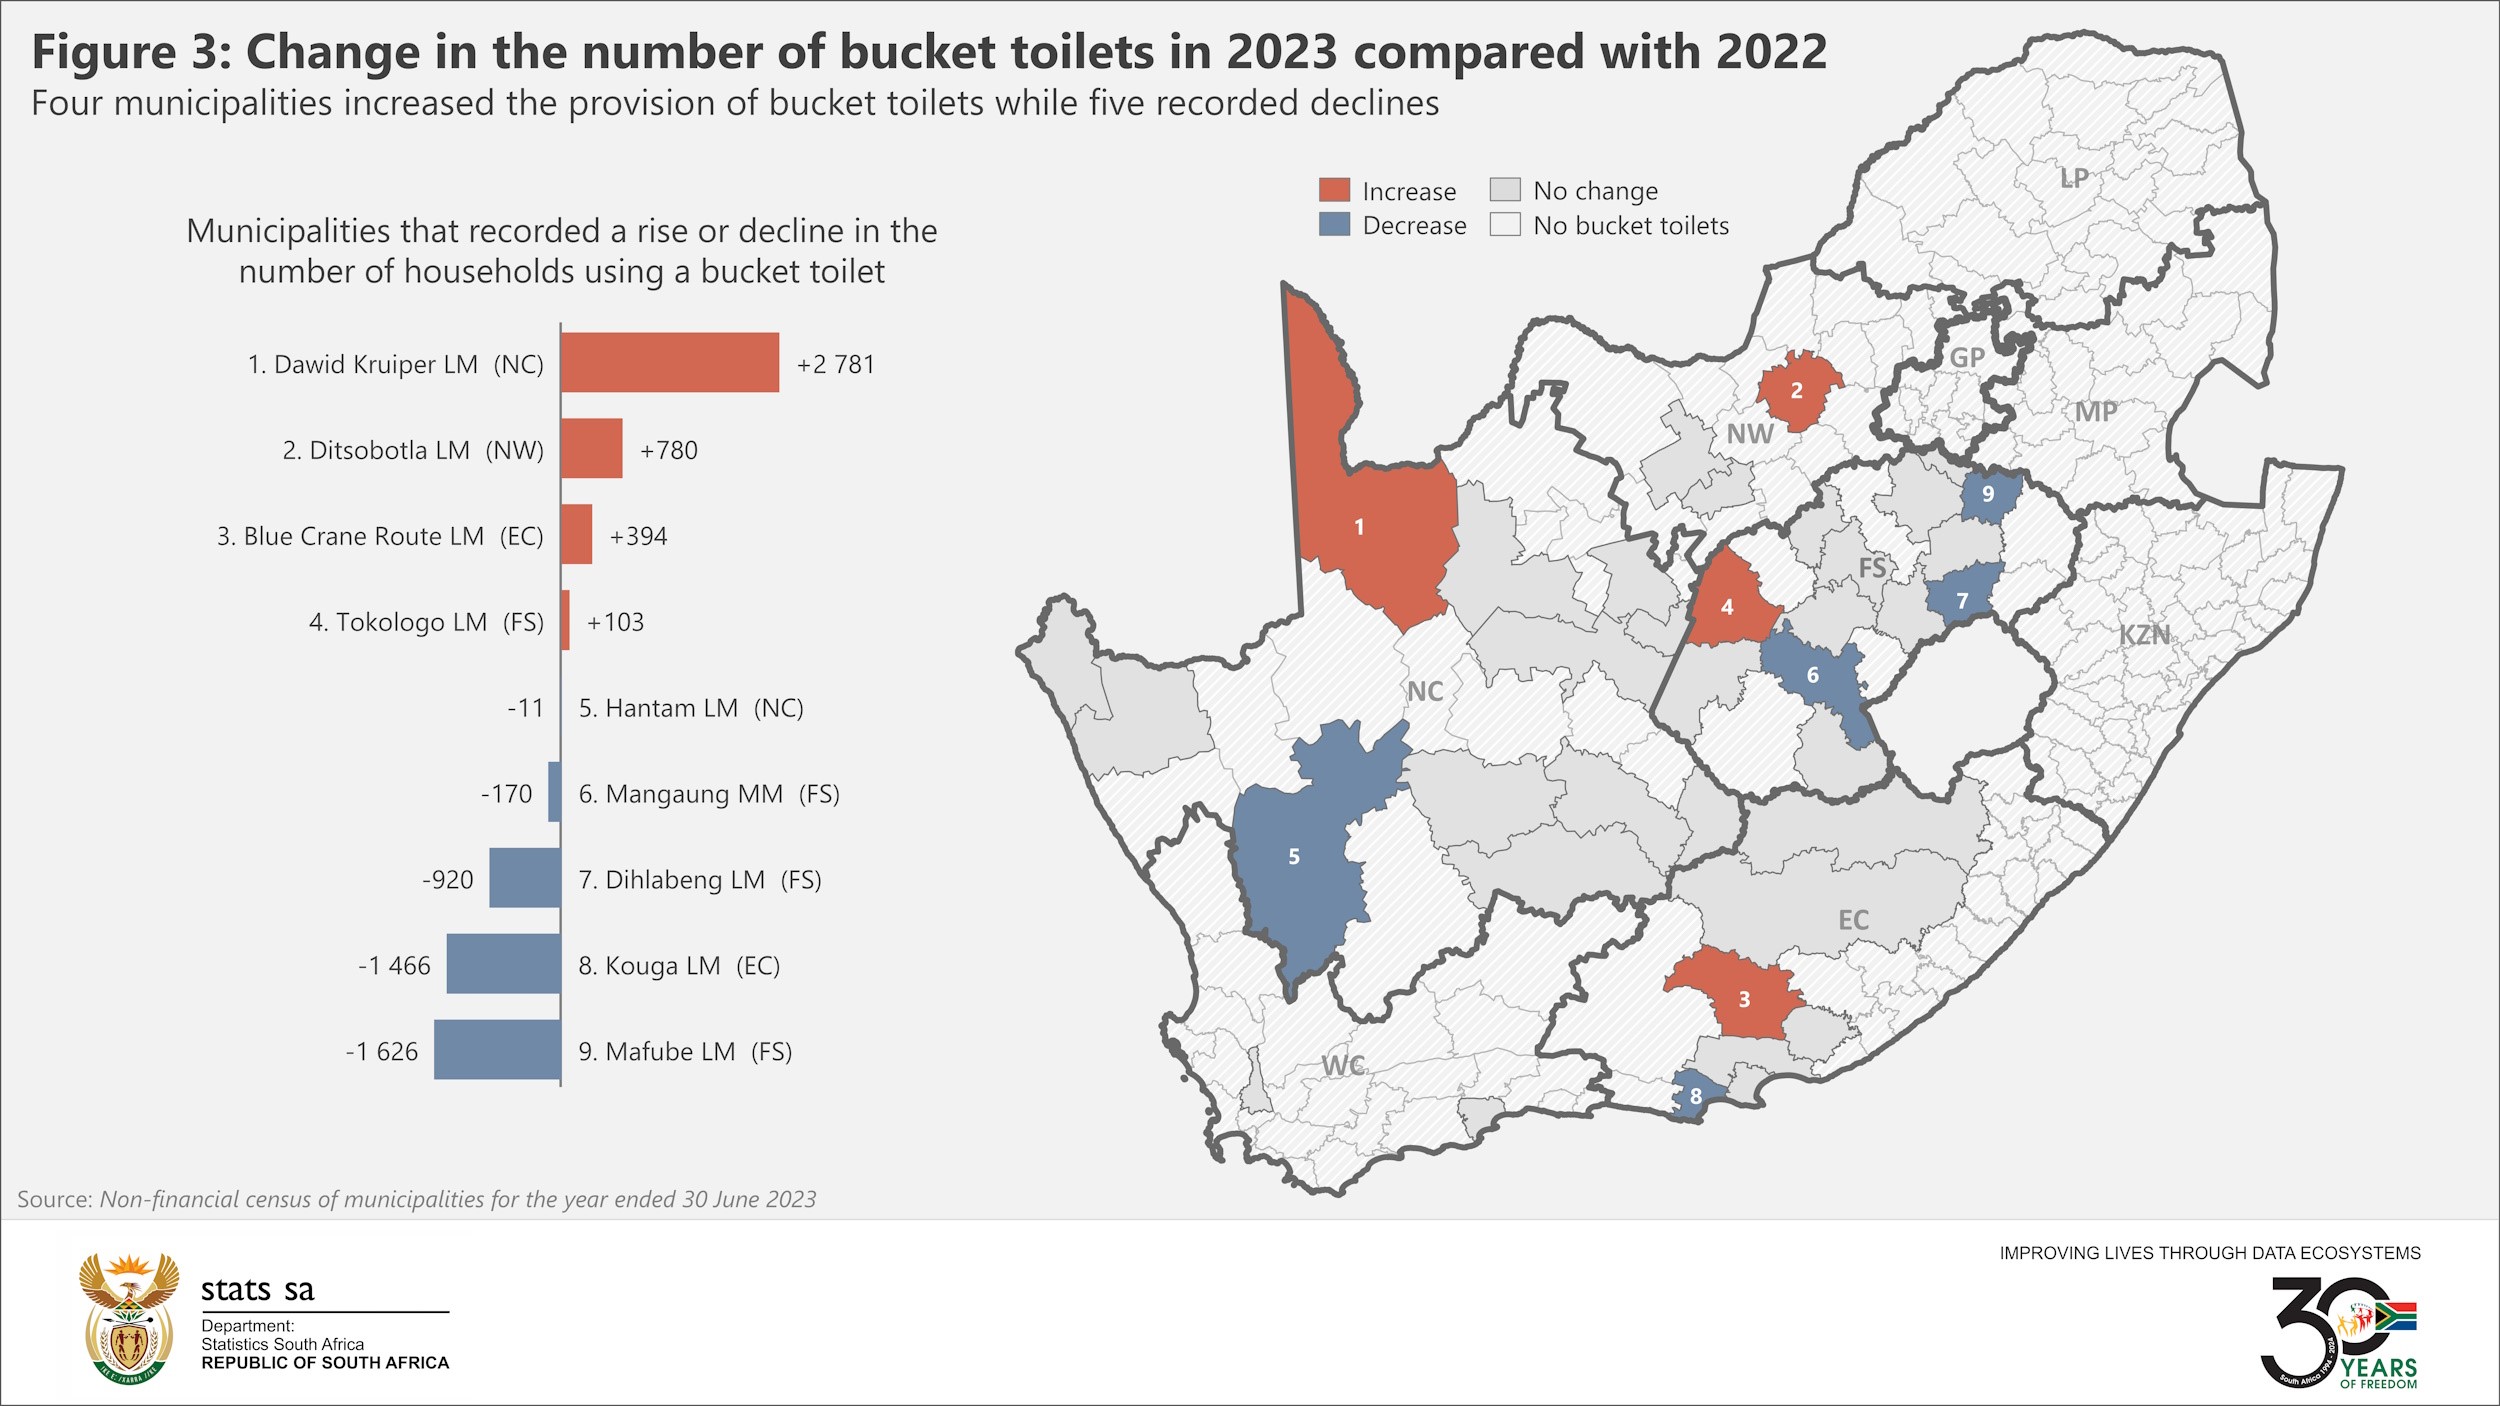
Four municipalities, however, recorded an increase in the use of bucket toilets. Dawid Kruiper in Northern Cape registered the highest increase of 2 781 households using the service. That was followed by Ditsobotla, with a rise of 780 households.
In summary, municipalities have cut back on the provision of bucket toilets over the last decade. However, overall prevalence remains above pre-pandemic lows, with several municipalities recording increased use.
For more information, download the 2023 Non-financial census of municipalities report and unit data here.
1 A consumer unit is an entity to which the service is (or would be) delivered, and which receives one utility bill. A consumer unit is alternatively known as a delivery point. This concept is often referred to as a household by municipalities, but this is not strictly correct, as households and consumer units do not coincide one-to-one, particularly in blocks of flats, on stands where there are multiple households in the same dwelling, and in cases where public taps are used.
2 Stats SA, Municipalities: where are the bucket toilets? [19 June 2017] (read here).
Similar articles are available on the Stats SA website and can be accessed here.
For a monthly overview of economic indicators and infographics, catch the latest edition of the Stats Biz newsletter here.