
The ebb and flow of energy in South Africa
Discovering the pathways that energy takes through the economy is the aim of the latest set of physical energy flow accounts. The accounts, published in a recent discussion document in the Stats SA Natural Capital series, cover the period 2015 to 2021 and provide a detailed overview of the flow of energy from its source to its end use.
What are physical flow accounts?
The physical energy flow accounts for South Africa are created from a wide range of data sources. The accounts are based on an internationally agreed accounting framework that records the movement of energy from the environment to the economy (i.e. natural inputs), within the economy (i.e. energy products) and from the economy back into the environment (i.e. residuals). These flows include several activities, such as the extraction, transformation, distribution and consumption of energy. Physical energy flow accounts provide valuable insight into how energy contributes to economic activity, and can aid better understanding into how energy generation and use might impact the environment.
Energy flows in our economy
The graphic below provides a summary of the physical energy flow accounts for the South African economy in 2021.1 On the left (supply) side, energy products are either sourced from imports, from local industries (i.e. mining, manufacturing, electricity and agriculture) or from accumulation. These products are made available in several different forms (e.g. coal, oil & oil products and electricity). On the right (use) side, energy products are either exported; transformed or consumed by local industries to produce goods and services; used by households; or stored in accumulation for later use.
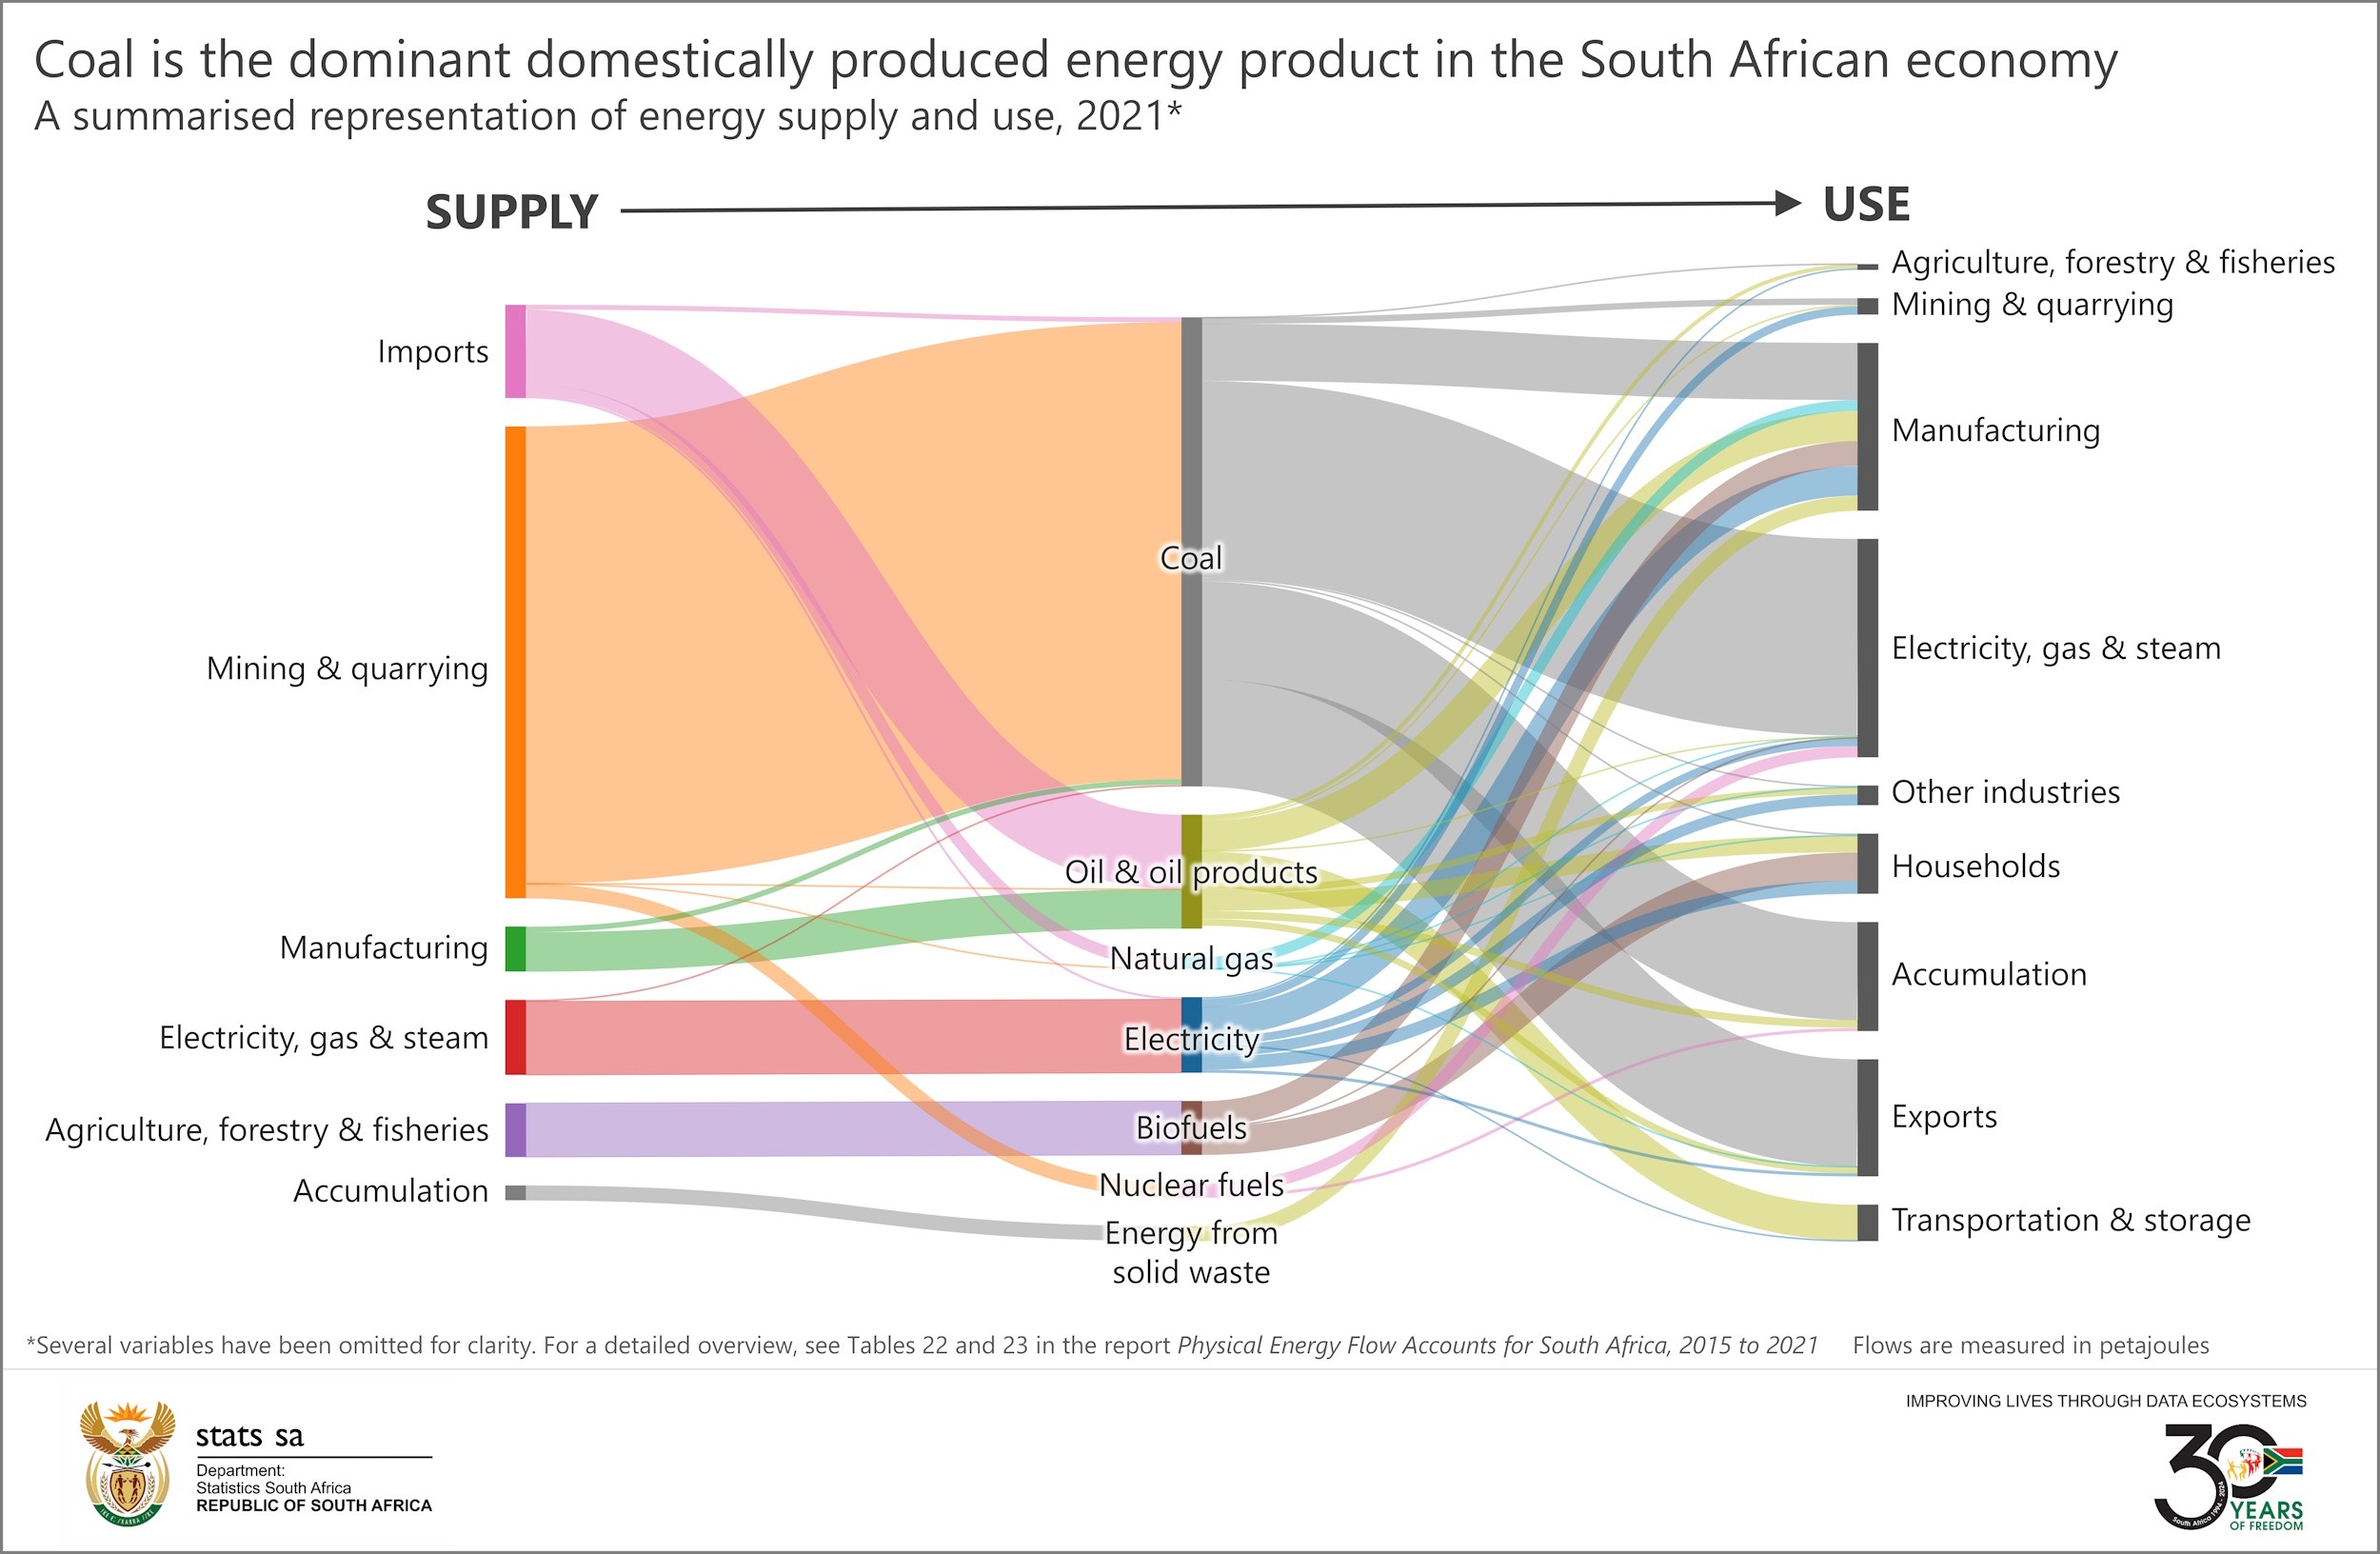
Three key characteristics stand out.
- Coal continues to dominate: Coal provided the bulk of South Africa’s energy supply in 2021, with most of it locally produced by the mining industry. The electricity, gas & steam supply industry was the biggest user, relying heavily on coal to generate electricity. Coal is a dominant component of South Africa’s energy product exports to the rest of the world, accounting for 92% of total energy exports in 2021.
- We import most of our oil & oil products: South Africa’s ability to produce oil & oil products (i.e. petrol and diesel) has weakened over the years. Local production declined notably between 2015 and 2021, mainly due to supply constraints caused by the closure of local oil refineries. Imports took up some of the slack, increasing in the 2016 to 2019 period. This was followed by a decrease in 2020 and 2021 during the COVID-19 pandemic. Despite this decline, oil & oil products remain the largest energy product import for South Africa, accounting for almost 80% of all energy imports in 2021. On the consumption side, oil & oil products are mainly used by the transport & storage and manufacturing industries.
- Households still rely heavily on biofuels: Biofuels are largely sourced from local agricultural activities and comprised the third-largest domestically produced energy product in 2021 after coal and electricity. They were predominantly used by households and manufacturing in 2021. Biofuels – which take the form of plant material, animal waste and municipal waste – accounted for almost half of household energy requirements that year, providing energy for heating, cooking and lighting. Data from the latest General Household Survey2 show wood as the second most popular source of energy (after electricity) used for cooking in Limpopo, Mpumalanga, North West, Eastern Cape and KwaZulu-Natal.
Exploring the time series
Tracking the energy data over time provides insight into how these energy flows have changed, and how total contributions to total energy product demand and supply have shifted. For example, electricity supply showed a declining trend from 2015 to 2021 due to the severe constraints experienced in the generation of electricity. Nuclear fuels, for example, accounted for 1,8% of the total domestic supply of energy products in 2015, rising to 2,3% in 2021.
For more information, download the Physical Energy Flow Accounts for South Africa, 2015 to 2021 report here.
This is the sixth discussion document published by Stats SA in the Natural Capital series. The other discussion documents available in the series include:
- Land and Terrestrial Ecosystem Accounts, 1990 to 2014 (download here).
- Accounts for Protected Areas, 1900 to 2020 (download here).
- Accounts for Strategic Water Source Areas, 1990 to 2020 (download here).
- Sub-national Water Resource Accounts, 2015 to 2021 (download here).
- Experimental Biodiversity-based Tourism Estimates for South Africa, 2013 to 2019 (download here).
1 The physical energy flow account provides additional detail not included in the graphic, such as inputs of energy from natural resources and renewable sources, residual flows and losses. See Tables 22 and 23 in the report for more detail.
2 General Household Survey (GHS), 2023. Figure 11.5 (download here).
Similar articles are available on the Stats SA website and can be accessed here.
For a monthly overview of economic indicators and infographics, catch the latest edition of the Stats Biz newsletter here.