Are South African industries dominated by a few firms?
Market share can be dominated by (and concentrated in) a few firms or shared more broadly across the economy. Concentration ratios and data on small, medium and large enterprises provide insight into the structure of our industries.
Concentration ratios for selected markets
The concentration ratio indicates the degree to which market share is distributed across the economy. A few giant firms or enterprises calling all the shots could stifle competition and potentially result in higher prices.
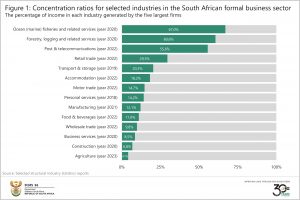
Stats SA publishes detailed reports on the composition of 16 industries, covering enterprises registered for value-added tax (VAT). Updated concentration ratios (for the period 2018–2022) are available for 14 of these. These ratios show the value of income that the five largest enterprises contribute to the industry’s total, expressed as a percentage. An industry with a high concentration ratio (i.e. near 100%) is a sign that a few, large enterprises dominate it. A relatively low concentration ratio (i.e. near 0%) indicates a diverse industry, with market share more equally distributed.
Of the 14 industries surveyed, ocean fisheries is the most concentrated, with a ratio of 67,0% (Figure 1). In other words, the five largest enterprises accounted for just over two-thirds of total income. Agriculture recorded the lowest ratio at 4,1%, indicating a more equal playing field.
Two quick notes about the data. First, Figure 1 does not show a complete picture, as updated concentration ratios are not available for mining and electricity, gas & water supply. However, small business data are available for these two industries – but more on that later!
Second, the latest data from the structural industry surveys might not cover the same year, hence the variance in reference dates. Due to the size and complexity of these surveys, updates are published every 3 to 5 years in a staggered cycle. This ensures that data are collected at a high level of detail, an advantage that the structural industry data have above most other industry-related surveys.
Digging deeper into the data
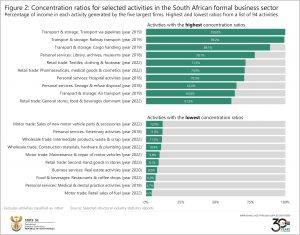
This additional detail allows for more in-depth analysis. Ten of the 14 reports provide concentration ratios at a more granular level, for 94 industrial activities in total. The four reports that are excluded are agriculture, forestry & logging, ocean fisheries and construction. The 94 activities with the highest and lowest concentration ratios are highlighted in Figure 2.
Several transport & storage industry activities exhibit high ratios, including transport via pipelines, railway transport and cargo handling. Air transport holds the ninth spot in the list, with a ratio of 63,8%.
On the other end of the scale, retail sales of fuel in the motor trade industry, medical & dental practices, and restaurants & coffee shops recorded the lowest concentration ratios.
Where do small businesses contribute?
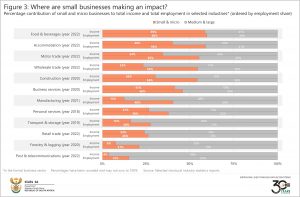
Another way to gauge dominance in an industry is to explore the distribution of small businesses. Twelve structural industry reports provide data on both income and employment for small, medium and micro enterprises (SMMEs).1 Small and micro businesses play a vital role in the food & beverages sector, accounting for 59% of total income generated and 60% of the labour force (Figure 3). Small and micro businesses also provide jobs to more than half of those employed in accommodation, motor trade, wholesale trade and construction.
Where have small businesses made inroads?
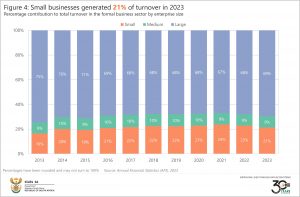
To see how small business influence has shifted over time, we turn to the Annual Financial Statistics (AFS) statistical release that provides a unified time series. Published annually, the AFS covers turnover data by business size for nine industries in the formal business sector.2
According to the data, small businesses generated 21% of turnover in AFS 2023. This is higher than the 16% recorded in AFS 2013 but down from the peak of 24% in AFS 2021 (Figure 4).
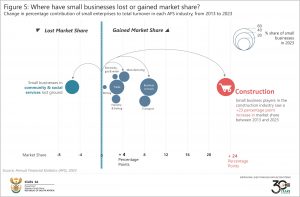
Figure 5 teases out the data for each AFS industry. The share of small business turnover increased across most industries since AFS 2013, except for community & social services, which registered a decline. The construction industry recorded the largest increase, with the share of small business turnover rising by 23 percentage points, from 17% in AFS 2013 to 40% in AFS 2023. Whether this is due to the growing prominence of small businesses or a decline in the influence of larger enterprises (or a combination of both) requires further research.
In contrast to the structural industry reports, data for mining and electricity, gas & water supply are included here. Both industries are dominated by large enterprises. Despite this, Figure 5 shows how smaller businesses have gained some, albeit modest, ground in these two industries.
In a nutshell, what do the concentration ratio and small business data tell us? First, mining; electricity, gas & water; ocean fisheries; forestry & fishing; and post & telecommunications are heavily concentrated industries. Second, small and micro businesses play an important role in employment across the formal business sector, most notably in food & beverages, accommodation, motor trade, wholesale trade and construction. Third, small businesses have increased their influence across parts of the formal business sector, although this influence has waned slightly since 2021.
Want to find out more?
If you’re interested in accessing the data related to concentration ratios, download the following structural industry reports. Most of these provide data on SMMEs:
- Agricultural survey, 2023 (available here).
- Forestry, logging and related services industry, 2020 (available here).
- Ocean (marine) fisheries and related services industry, 2020 (available here).
- Manufacturing industry – financial detail, 2021 (available here).
- Construction industry, 2020 (available here).
- Wholesale trade industry, 2022 (available here).
- Motor trade industry, 2022 (available here).
- Retail trade industry, 2022 (available here).
- Accommodation industry, 2022 (available here).
- Food and beverages industry, 2022 (available here).
- Transport and storage industry, 2019 (available here).
- Post and telecommunications industry, 2022 (available here).
- Real estate, activities auxiliary to financial intermediation and business services industry, 2020 (available here).
- Personal services, 2018 (available here).
Small business turnover data from the AFS are available for download here. The data are available in the Estimates by business size 2022 2023 Excel file under ‘Additional downloads’.
1 Please refer to the releases and reports sourced in this article for information on how the size groups (micro, small, medium and large) are classified.
2 The AFS excludes agriculture and hunting; general government and educational institutions; and financial intermediation, pension funding, insurance and business services not elsewhere classified.
Similar articles are available on the Stats SA website and can be accessed here.
For a monthly overview of economic indicators and infographics, catch the latest edition of the Stats Biz newsletter here.


