Inflation edges higher in November
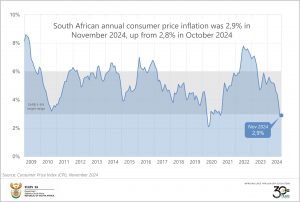
Annual consumer inflation was 2,9% in November, slightly up from 2,8% in October. There was no change in the consumer price index (CPI) between October and November.
Food inflation is the lowest in 14 years
Annual inflation for food & non-alcoholic beverages (NAB) witnessed another sharp decline in November, slowing to 2,3% from 3,6% in October. This marks the lowest inflation rate for the category since December 2010, when it stood at 1,6%. Eight of the 11 food & NAB groups registered lower rates, including vegetables; milk, eggs & cheese; hot beverages; bread & cereals; cold beverages; meat; sugar, sweets & desserts; and the miscellaneous category ‘other’ food. Fish inflation was flat, while oils & fats and fruit recorded steeper price increases.
The annual rate for bread & cereals moderated further, cooling to its lowest level in almost three years. Important items such as brown bread, white bread, maize meal, cold cereals, pasta and rice recorded lower rates. Inflation quickened for several products, including samp and hot cereals.
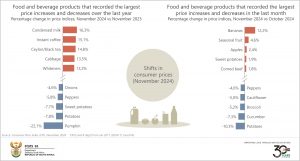
Annual milk, eggs & cheese inflation declined to its lowest level in almost five-and-a-half years. After burning a hole in households’ food budgets for much of 2024, egg inflation descended into deflationary territory in November, falling to -3,7%. This is down from a high of 39,9% a year ago.
The graphs below show food and beverage products that recorded significant price changes in November.
Other notable price changes
Fuel increased by 0,9% month-on-month in November, taking the annual rate to -13,6% from -19,1% in October.
The price index for the restaurants & hotels category rose by 5,9% in the 12 months to November, with increases recorded for both restaurants (+5,1%) and hotels (+7,5%). Annual inflation for restaurants & hotels is down from the recent high of 7,5% in June this year.
Inflation hits the poor the hardest
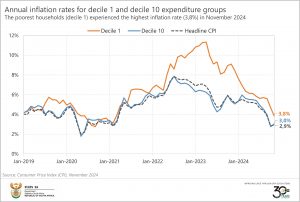
Stats SA calculates inflation rates for ten expenditure categories, providing insight into the impact of inflation on various socio-economic groups. The poorest households (decile 1) have shouldered the highest inflation rate since January 2022, peaking at 11,3% in April 2023. This declined to 3,8% in November 2024 but remains the highest across all expenditure categories. By contrast, the wealthiest households (decile 10) registered an annual increase of 3,0% in November, slightly above the headline rate.
Western Cape has the highest inflation rate
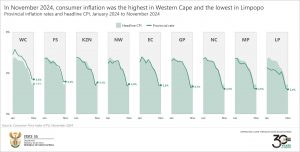
Stats SA calculates provincial inflation rates as well. In November the provinces with the highest inflation rates were Western Cape (3,4%), Free State (3,2%) and KwaZulu-Natal (3,1%). Inflation in Western Cape remained above the headline rate for the period January to November 2024.
Limpopo (2,4%) and Mpumalanga (2,5%) recorded the lowest rates in November.
For more information, download the November 2024 CPI statistical release and associated Excel files with indices and average prices here. The archive is available here.
Similar articles are available on the Stats SA website and can be accessed here.
For a monthly overview of economic indicators and infographics, catch the latest edition of the Stats Biz newsletter here.


