Economic activity declines in the third quarter
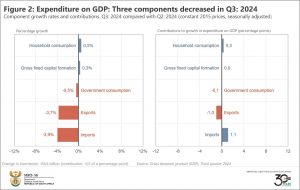
Real South African gross domestic product (GDP) weakened by 0,3% in the third quarter (July–September) of 2024.1 The agriculture industry was the main drag on growth on the production (supply) side of the economy, with transport, trade and government services also contributing to the slowdown. On the expenditure (demand) side, there was a decline in imports, exports and government consumption.
Agriculture leaves a dent in GDP growth
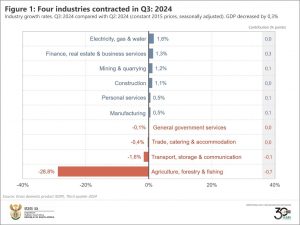
Agriculture recorded its second consecutive decline, falling by 28,8% in the third quarter. It was the largest negative contributor, pulling GDP growth down by 0,7 of a percentage point (Figure 1).
The industry experienced a rough quarter. Drought plagued the production of field crops such as maize, soya beans, wheat and sunflower. Adverse weather conditions also hindered the production of subtropical fruits, deciduous fruits and vegetables in parts of the country.
Three other industries also performed poorly. Transport, storage & communication was the second largest negative contributor, recording a decline in land transport and transport support services. Disappointing figures from the wholesale trade, motor trade and restaurant, fast-food & catering sectors pushed the trade, catering & accommodation industry lower. The general government was weaker on the back of lower employment numbers in the civil service.
Not all was bad news. Finance was the largest positive contributor, pushed higher by banking, insurance, real estate and other business services. The electricity, gas & water supply industry expanded for a second straight quarter, driven higher by a rise in electricity generation and consumption. Stronger manganese and chromium ore production helped boost mining. Iron, steel & machinery production drove much of the upward momentum in manufacturing.
Construction’s second straight rise of 1,1% may seem relatively small, but it’s the biggest increase in two years. The positive showing in the third quarter was mainly driven by construction works, with support from activities related to non-residential buildings.
Muted trade activity as exports and imports decline
On the expenditure (demand) side of the economy, exports decreased by 3,7%, representing the largest decline in three years. The slump was mainly due to weaker trade in pearls, precious & semi-precious stones and precious metals; vehicles & transport equipment (excluding large aircraft); chemical products; base metals & articles of base metals; and machinery and electrical equipment.
Imports were also down (-3,9%), driven lower by decreased trade in vehicles & transport equipment (excluding large aircraft); mineral products; vegetable products; and base metals & articles of base metals.
Gambling leaves a mark on household spending
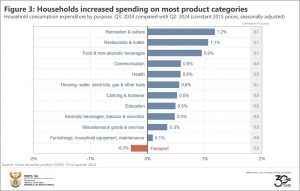
Households increased consumption expenditure by 0,5% in the third quarter. Consumers spent more across most product categories, except for transport (Figure 3).
Recreation & culture recorded the highest growth rate (1,2%). Closer exploration of this category shows gambling as a notable contributor to this increase. Gambling has risen sharply in recent years, according to the latest set of statistics from the South African National Gambling Board. Gross gambling revenue totalled R59,3 billion in 2023/24, a 25,7% rise from the year before. This follows an increase of 37,0% in 2022/23.2
The automotive sector takes strain
One other key takeaway from the GDP numbers is the current weakness in the automotive sector. On the manufacturing side, the production of transport equipment disappointed in the third quarter. The most recent monthly manufacturing release shows a pullback in the production of motor vehicles over this period.3 As mentioned above, motor trade sales and household spending on transport are both weaker. Exports and imports of passenger vehicles were also down in the third quarter.
For more information, download the latest GDP release, media presentation and Excel files here.
1 The quarter-on-quarter rates are seasonally adjusted and in real (volume) terms (constant 2015 prices).
2 National Gambling Board of South Africa. Annual Report, 2023/24. Figure 4 (download here).
3 Stats SA. Manufacturing: Production and sales, September 2024. Table B (download here).
Similar articles are available on the Stats SA website and can be accessed here.
For a monthly overview of economic indicators and infographics, catch the latest edition of the Stats Biz newsletter here.


