How did government spending shift in 2022/23?
The latest set of consolidated government financial data show a rise in spending between the 2021/22 and 2022/23 fiscal years. Several government functions benefited from the increase, while others recorded declines.
The Financial statistics of consolidated general government statistical release provides a complete overview of revenue and spending across all 702 government institutions, including national, provincial and local government; extra-budgetary accounts & funds; and higher education.
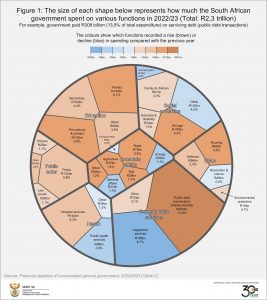
The South African government spent R2,3 trillion in 2022/23, a rise of R91 billion from the year before.1 Figure 1 shows how the money was distributed, providing a bird’s-eye view of government’s spending priorities. The size of each shape in Figure 1 represents the expenditure per function. For example, tertiary education spent R140 billion, or 6,1% of the pie. Spending on secondary education accounted for R100 billion, or 4,4% of the total (click on the image to enlarge).
Debt payments continue to eat up more of the budget
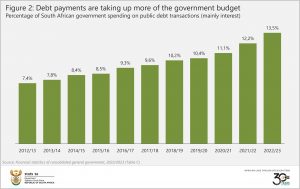
What is striking is the size of public debt transactions, the biggest slice in the graphic. This represents the amount of money that government spends on servicing its debt, which mainly includes interest payments. Public debt transactions accounted for R308 billion or 13,5% of total expenditure in 2022/23. In other words, for every R100 of government spending, R13,50 was directed towards managing the country’s debt burden.
Not only was this the largest line item, but it also recorded the sharpest increase – in rand terms – from the previous year, rising by R40 billion. Its contribution to total expenditure has also trended upwards over time. Public debt transactions accounted for 7,4% of total government spending in 2012/13, rising to 12,2% in 2021/22 and 13,5% in 2022/23 (Figure 2).
Other functions that registered large increases in 2022/23 compared with 2021/22 include:
- Tertiary education (up R13 billion): This was mainly due to increased spending by the National Student Financial Aid Scheme; KwaZulu-Natal and Gauteng provincial governments; and higher education institutions.
- Road transport (up R12 billion): SANRAL was the largest contributor here, expanding operations and increasing capital transfers to public corporations.
- Housing (up R9 billion): Increased expenditure was mainly driven by the Water Trading Entity and municipal housing programmes.
- Rail transport (up R9 billion): This rise was mainly driven by a capital transfer from the Department of Transport to the Passenger Rail Agency of South Africa for the Rolling Stock Fleet Renewal Programme.
The bump in spending on road transport, housing and rail transport provides some positive news on the infrastructure front. This reflects other data that show a consistent rise in public-sector capital expenditure since 2021.2
The lingering shadow of the 2021 riots
The second largest item in 2022/23 was legislative services,3 accounting for R199 billion or 8,7% of total spending. This category covers expenditure related to the administration of parliament, the provincial legislatures and mayoral offices, as well as financial and fiscal affairs.
Legislative services witnessed the sharpest decrease between 2021/22 and 2022/23, falling by R27 billion. This was mainly due to the base effect, following an unusually high expenditure spike in 2021/22 for one of the line items in this category. The spike was a large once-off government cash transfer to the South African Special Risk Insurance Association (SASRIA), the public-sector institution responsible for providing insurance cover for riots, strikes and terrorist attacks.
In July 2021, civil unrest spread across parts of KwaZulu-Natal and Gauteng, resulting in extensive damage to property and infrastructure. The transfer of R22 billion to SASRIA was a lifeline to help cover the deluge of claims arising from the unrest. SASRIA recently reported that it settled more than 20 000 claims following the riots, totalling R31 billion.4 This financial shock was unique to 2021/22, with much of the spending in the legislative services category returning to ‘normal’ in 2022/23, resulting in the decrease.
There were other, smaller, underlying factors. For example, financial transfers to the South African Custom Union (SACU) were lower in 2022/23, contributing to the overall pullback in legislative services. SACU financial transfers fluctuate year-to-year according to trade volumes between member countries.5
Other functions that registered large decreases between 2021/22 and 2022/23 include:
- Unemployment relief (down R8 billion): The Unemployment Insurance Fund recorded a decline in payments to beneficiaries.
- Energy (down R8 billion): As in the case of legislative services, the decrease here was largely due to the base effect, reflecting a return to ‘normal’ after a sharp rise in 2021/22 (caused mainly by a cash injection for Eskom).
- Public health services (down R6 billion): The Department of Health spent less on goods and services, mainly due to a pullback in the procurement of COVID-19 vaccines.
For more information, download the 2022/2023 Financial statistics of consolidated general government statistical release and time series data here.
1 When interpreting these figures, note that the data published in the Financial statistics of consolidated general government statistical release (a) are adjusted for the reference period 1 April – 31 March; (b) in order to compare across all levels of government, data are converted from an accrual basis of recording to a cash basis of recording; and (c) transactions are classified according to the 2014 edition of the Government Finance Statistics Manual.
2 Stats SA, Public-sector capex rises for a second straight year (read here).
3 The complete name for the category is ‘Executive and legislative organs, financial and fiscal affairs, external affairs’.
4 SASRIA, Integrated Report, 2024. Pages 4 and 8 (download here).
5 For more information on the SACU, see Stats SA, A 110-year-old trade venture (read here).


