Sequencing the DNA of provincial economies
Each province has its own unique economic profile. The latest set of regional gross domestic product (GDP) figures paint a picture of what drives economic activity in each province. The data also shows what each province brings to the economic table of the country.
Which industries drive your provincial economy?
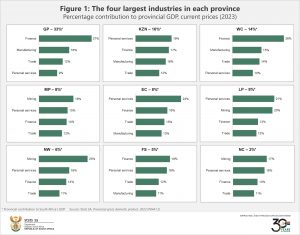
Gauteng is the nation’s economic powerhouse. In 2023, finance, real estate & business services was the largest industry in that province, accounting for 27% of provincial GDP (Figure 1). Manufacturing was the second largest industry in Gauteng, contributing 16%.
Cape and Mpumalanga. Together, these three provinces account for almost 60% of national agricultural activity.
Finance, real estate & business services was the biggest driver of economic activity in Western Cape and Free State. Mining was the largest industry in Mpumalanga, North West and Northern Cape, and the second largest in Limpopo. Personal services – which includes health and education – took the lead in KwaZulu-Natal, Limpopo and Eastern Cape.
Where are industries concentrated?
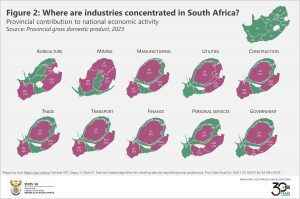
Industrial activity is clustered in various parts of the country. A neat way to highlight how industries are distributed across South Africa is with the use of cartograms1 (Figure 2). National agricultural production, for example, is concentrated in KwaZulu-Natal, Western Cape and Mpumalanga. Together, these three provinces account for almost 60% of national agricultural activity.
The country depends heavily on North West, Limpopo and Mpumalanga for the bulk of its mining wealth, and we can thank Gauteng, KwaZulu-Natal and Western Cape for 75% of overall manufacturing output.
Employment data closely mirror these figures, according to Stats SA’s structural industry reports for mining2 and manufacturing.3 Almost two-thirds of mining jobs are in North West, Limpopo and Mpumalanga. Eight in ten South African manufacturing workers are employed in Gauteng, KwaZulu-Natal and Western Cape.
Figure 2 also highlights the dominance of Gauteng. This province is the largest driver of economic activity for eight of the ten industries, most notably finance, real estate & business services; manufacturing; and government services.
For more information, download the 2023 provincial GDP statistical release and data here.
1 The cartograms in Figure 2 were created using the site https://go-cart.io/. For more information, see Gastner MT, Seguy V, More P. Fast flow-based algorithm for creating density-equalizing map projections. Proc Natl Acad Sci USA 115(10):E2156–E2164 (2018) (available here).
2 Stats SA, Mining industry, Report No.: 20-01-02 (2022). Table D (download here).
3 Stats SA, Manufacturing industry: Financial, Report No.: 30-02-03 (2021). Table G (download here).
Similar articles are available on the Stats SA website and can be accessed here.
For a monthly overview of economic indicators and infographics, catch the latest edition of the Stats Biz newsletter here.


