
Empty stomachs, empty classrooms: Investment in school feeding schemes
Empty stomachs, empty classrooms: Investment in school feeding schemes
The South African government spent R8,4 billion in 2022/23 on its nationwide school feeding scheme. Recent data provides a provincial breakdown, as well as how this spending has shifted over the years.
South Africa’s school-nutrition programme
In 1994, the South African government established the National School Nutrition Programme (NSNP), a nationwide project that provides meals to schools in poorer communities.1 The aim of the programme is to ensure that learners receive adequate nutritional support, contributing to good health and improved academic performance.
The task of managing the country’s education system lies mainly with provincial government, making it the financial custodian of the programme. Provincial government spent R299,7 billion on education in 2022/23, according to data from the latest Financial statistics of provincial government statistical release.2 The NSNP accounted for 2,8% (or R8,4 billion) of this total.
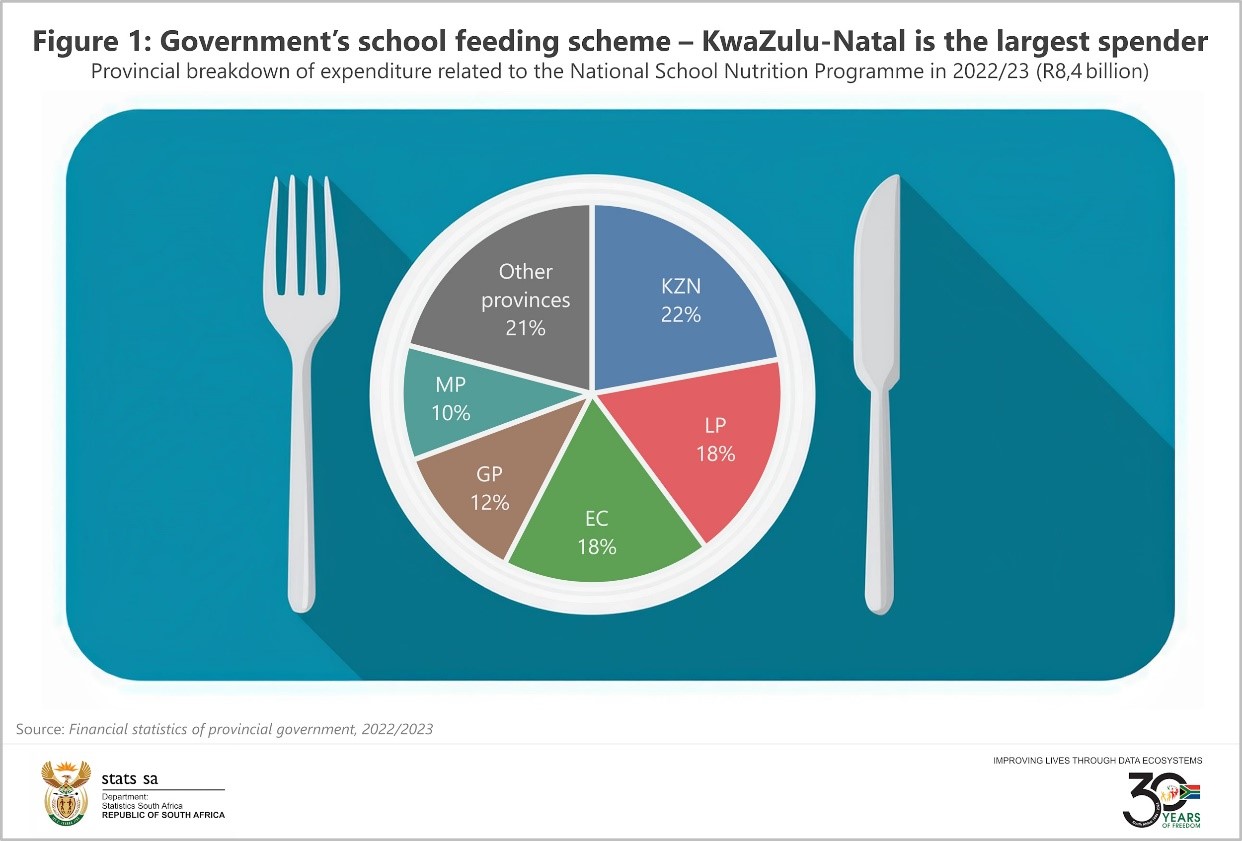
KwaZulu-Natal was the largest spender of NSNP funds, representing 22% (or R1,9 billion). Limpopo and Eastern Cape accounted for 18% each and Gauteng 12% (Figure 1).
Provincial funding for education rose from R244,2 billion in 2018/19 to R299,7 billion in 2022/23. The percentage allocated to the NSNP remained relatively stable over this period in the 2,7–2,9% range.
At the height of the COVID-19 pandemic (2020/21), expenditure on the NSNP decreased in four provinces, including KwaZulu-Natal, Limpopo, Mpumalanga and Gauteng, with the sharpest declines recorded in Limpopo and KwaZulu-Natal (Figure 2).
Digging into departmental annual reports provides some insight into these decreases. In Limpopo, there were three main reasons for underspending on the NSNP: learners did not attend schools during the months of April, May and June due to the lockdown; vacancies related to the programme were not filled; and feeding scheme invoices for March 2021 were not paid in full.3 In KwaZulu-Natal, unpaid invoices contributed to the decline. The school feeding programme in the province was also beset with investigations into tender award processes.4
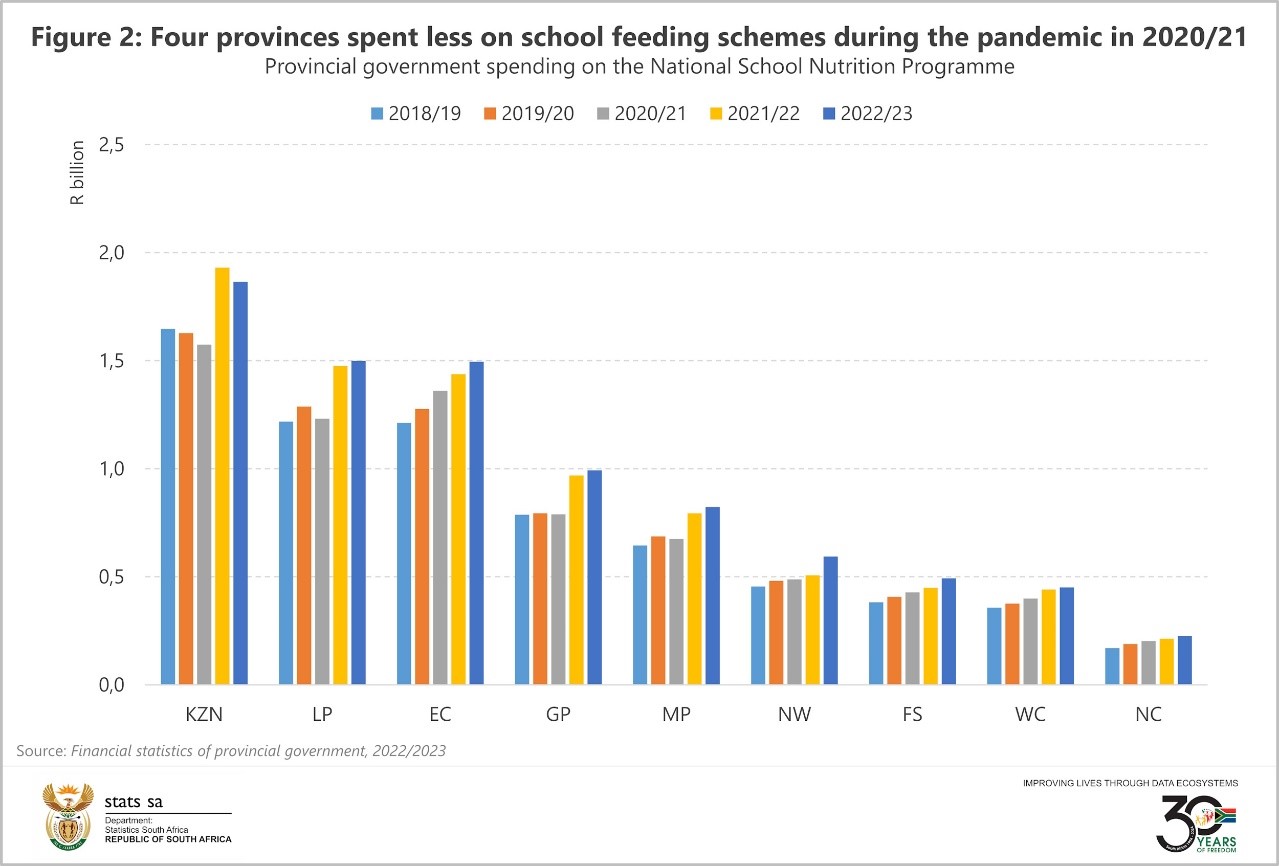
The notable exception was Eastern Cape. This province recorded a sharp rise in 2020/21. According to the province, this was mainly due to broadening the NSNP to include more learners, as well as introducing an additional meal (in the form of breakfast) in the poorest schools.5
There was some recovery in 2021/22, with the largest increases recorded in KwaZulu-Natal and Limpopo.
Fast-forward to the most recent data. Spending on the NSNP rose in eight provinces in 2022/23 compared with 2021/22, except for KwaZulu-Natal, which registered a decline of R66 million.
An overview of hunger in South Africa
The importance of NSNP can’t be understated. According to the Department of Basic Education, 9,7 million learners in over 21 000 schools depend on the programme.6 That’s about 3 in every 4 learners, if we consider the total number of 12,7 million attending public education.7
While South Africa has made strides in reducing overall hunger, the country must remain vigilant. The percentage of individuals who experienced hunger declined from 29,3% in 2002 to 11,1% in 2019, according to the latest General Household Survey.8 However, hunger has seen some resurgence, rising to 15,0% in 2023.
Children are particularly vulnerable to malnutrition. Serious developmental risks, such as stunting, can arise from insufficient access to food. In 2021, 3,8% of all households with young children reported experiencing hunger.9 That’s over half a million households nationwide, mainly concentrated in the provinces of Gauteng, KwaZulu-Natal, Western Cape and Mpumalanga. At a granular level, non-metro areas in KwaZulu-Natal, the City of Johannesburg and the City of Cape Town recorded the highest number of food-vulnerable households.
For more information, download the latest Financial statistics of provincial government statistical release here.
1 Department of Basic Education, National School Nutrition Programme. Available here [accessed: 23 September 2024].
2 The Financial statistics of provincial government statistical release is one of several government financial reports published by Stats SA. Other reports include national government, local government, extra-budgetary accounts and funds and higher education institutions. A consolidated release, which incorporates data from all these publications, will be available in November.
3 Limpopo Department of Education, Annual report, 2020/21. Pages 77 and 238 (download here).
4 KwaZulu-Natal Department of Education, Annual report, 2020/21. Pages 100, 107 and 176 (download here).
5 Eastern Cape Department of Education, Annual report, 2020/21. Page 7 (download here).
6 Department of Basic Education, Annual report, 2022/23. Page 205 (download here).
7 Department of Basic Education, Annual report, 2022/23. Table 35 (download here).
8 Stats SA, General Household Survey, 2023. Figure 17.1 (download here).
9 Stats SA, Assessing food inadequacy and hunger in South Africa in 2021. Tables 6.2.1 and 6.2.2 (see a summary article here and download the complete report here).
Similar articles are available on the Stats SA website and can be accessed here.
For a monthly overview of economic indicators and infographics, catch the latest edition of the Stats Biz newsletter here.