
SA economy grows in the second quarter
The South African economy strengthened by 0,4%1 in the second quarter (April–June) of 2024. The finance, manufacturing, trade, and electricity, gas & water supply industries drove most of the economy’s momentum on the production (supply) side. On the expenditure (demand) side, household consumption, government consumption and a build-up in inventories contributed favourably to growth.
Seven industries record gains
On the production side of the economy, the finance, real estate & business services industry made the biggest impact, adding 0,3 of a percentage point to gross domestic product (GDP) growth (Figure 1).
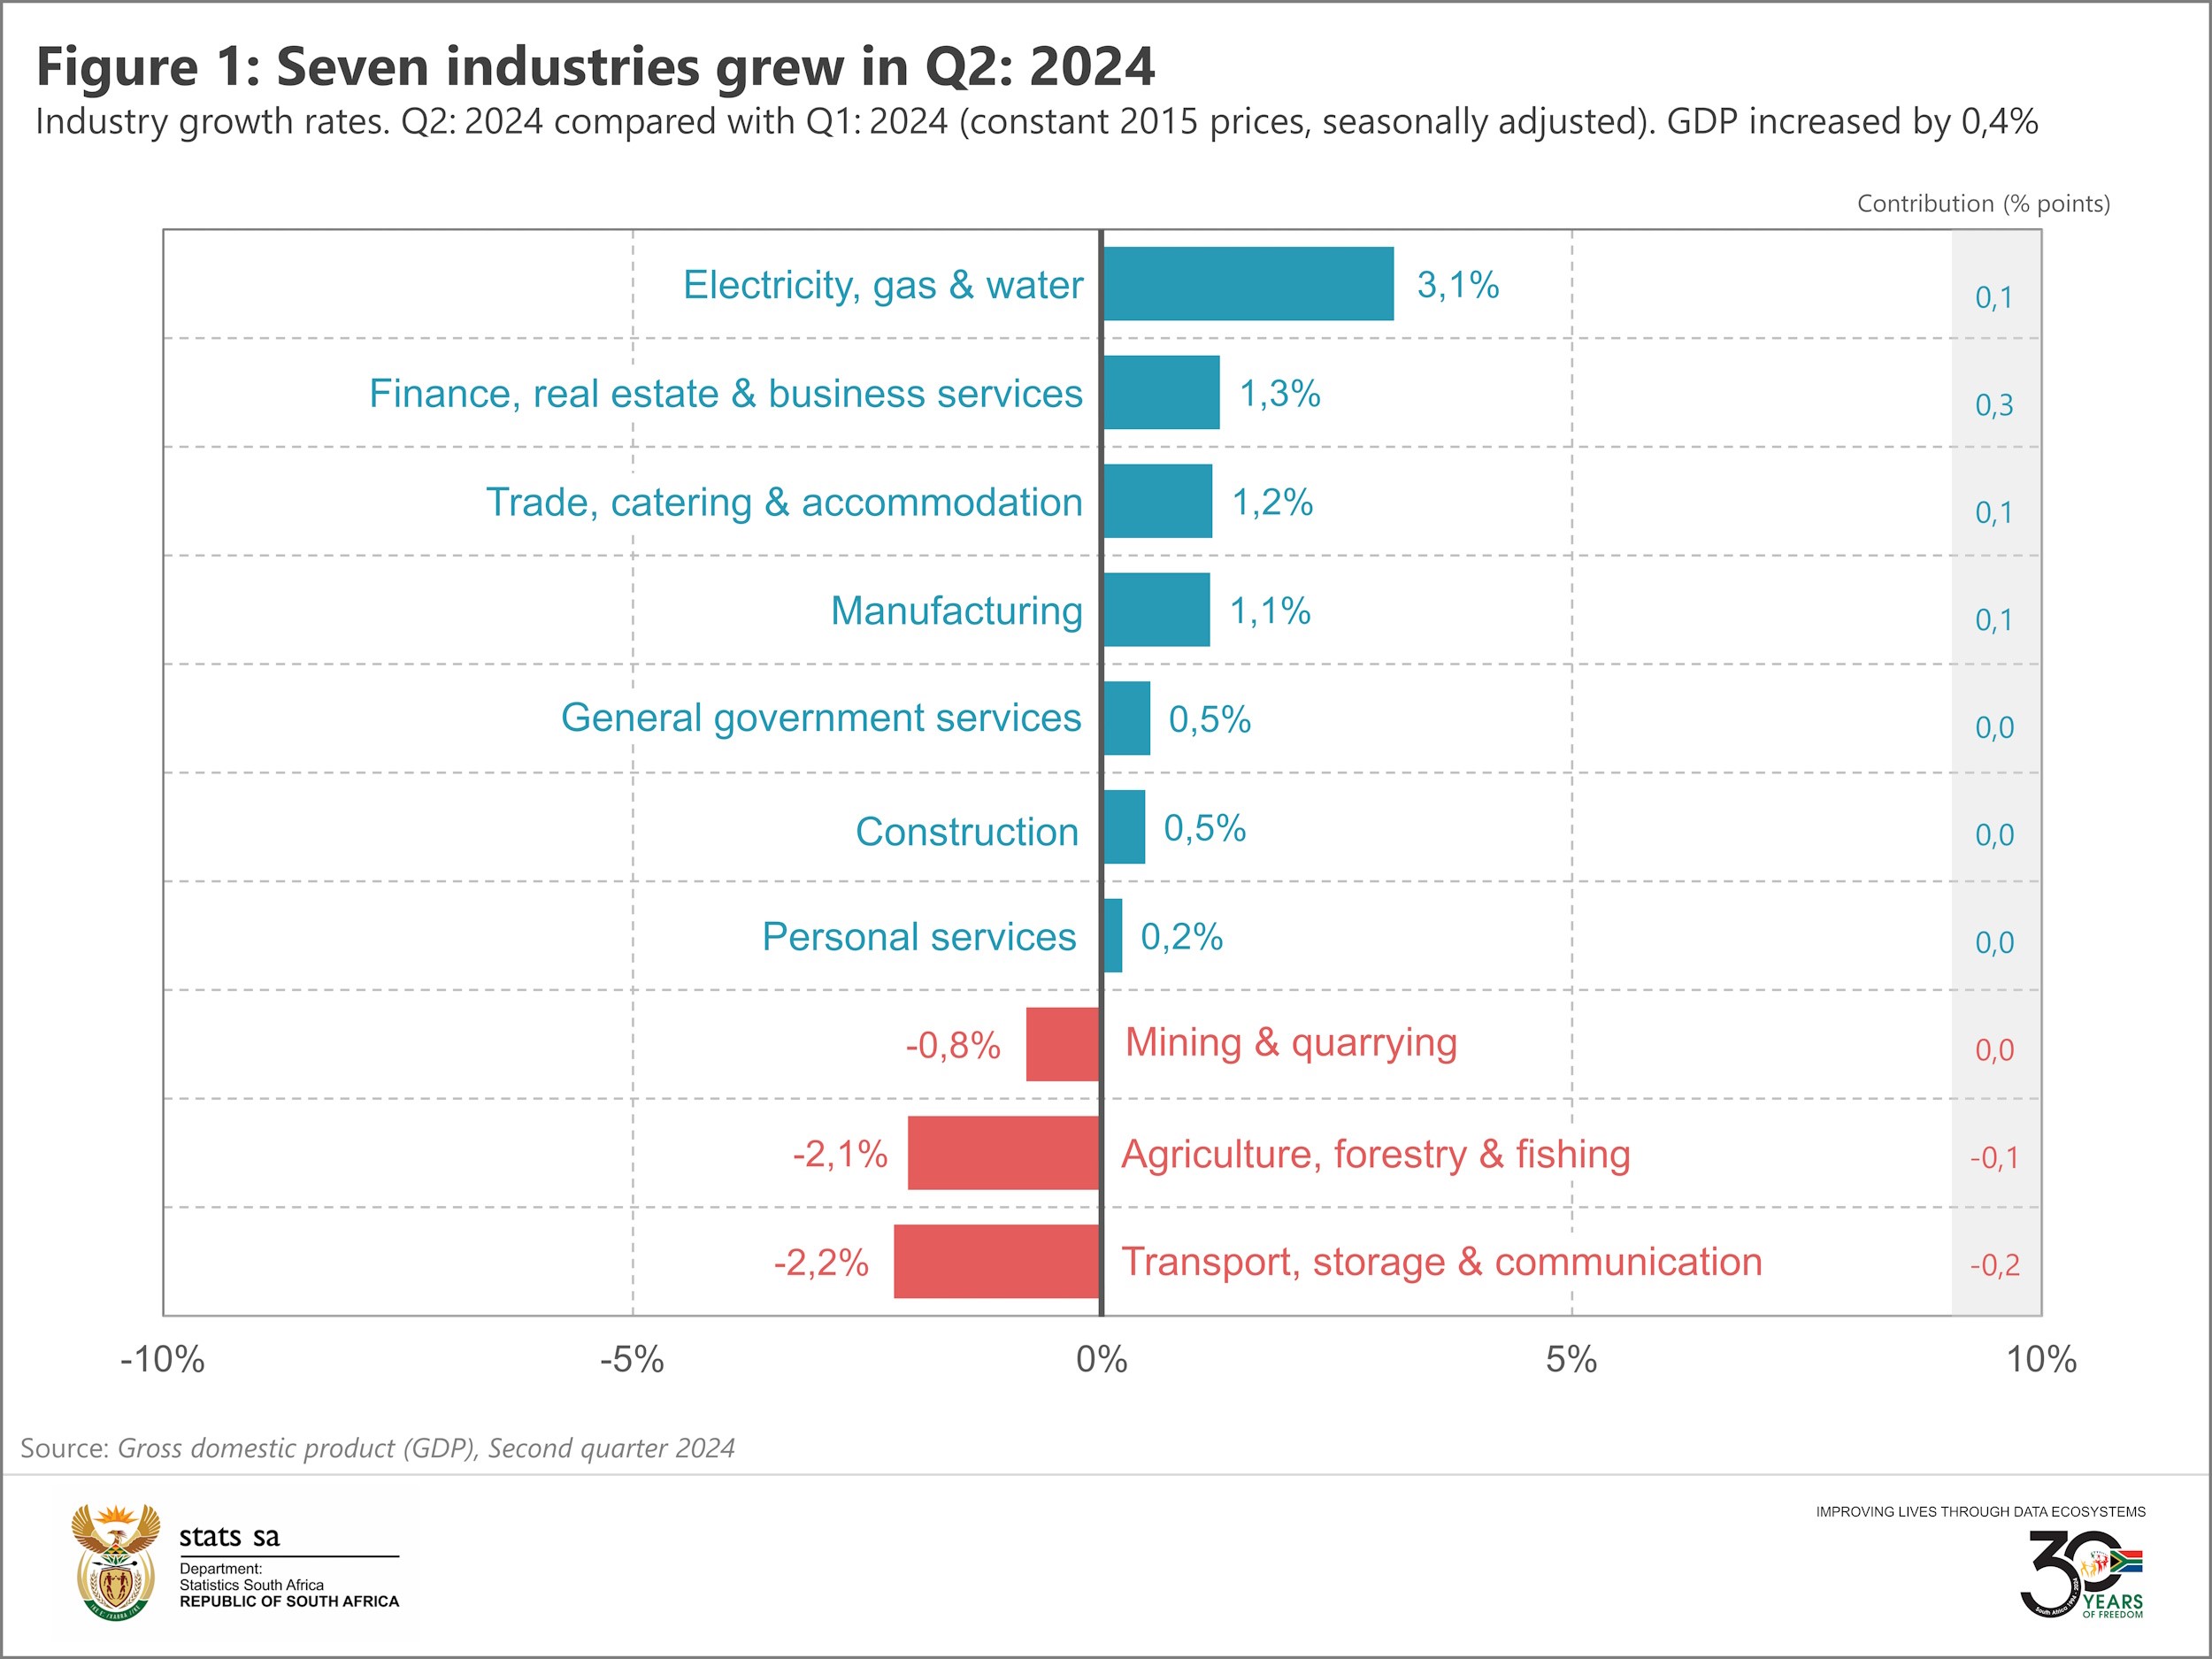
Other notable contributors include manufacturing, trade, and electricity, gas & water. Manufacturing turned positive after shrinking in the first quarter, rising by 1,1% in the second quarter. Production was mainly driven by motor vehicles & transport equipment and food & beverages.
Buoyant economic activity in wholesale, retail and tourist accommodation pushed the trade, catering & accommodation industry higher by 1,2%.
The country experienced no load shedding in the second quarter,2 which helped the electricity, gas & water supply industry. It grew by 3,1%, driven by increased electricity generation and water distribution. If we ignore the topsy-turvy economic environment caused by the pandemic in 2020, the 3,1% growth rate represents the sharpest increase since the third quarter of 2008 (also 3,1%).
The construction industry showed some growth after a year of decline, edging marginally higher in the second quarter. The rise was driven by economic activity related to residential and non-residential buildings. However, there was a slowdown in construction works.
Three industries contracted in the second quarter. Transport, storage & communication was the largest negative contributor, declining by 2,2% and dragging GDP growth down by 0,2 of a percentage point. Strike action and a fall in freight volumes contributed to the industry’s poor performance.
Agriculture, forestry & fishing faced headwinds, including lower than expected rainfall in some parts of the country (affecting maize and soya bean production), heavy rain in KwaZulu-Natal (affecting sugar cane production), and foot-and-mouth disease (affecting sheep and pork production).
Mining recorded a second consecutive decline. The industry’s poor showing in the second quarter was associated with decreased production of iron ore, coal, diamonds and gold.
Household spending a notable contributor
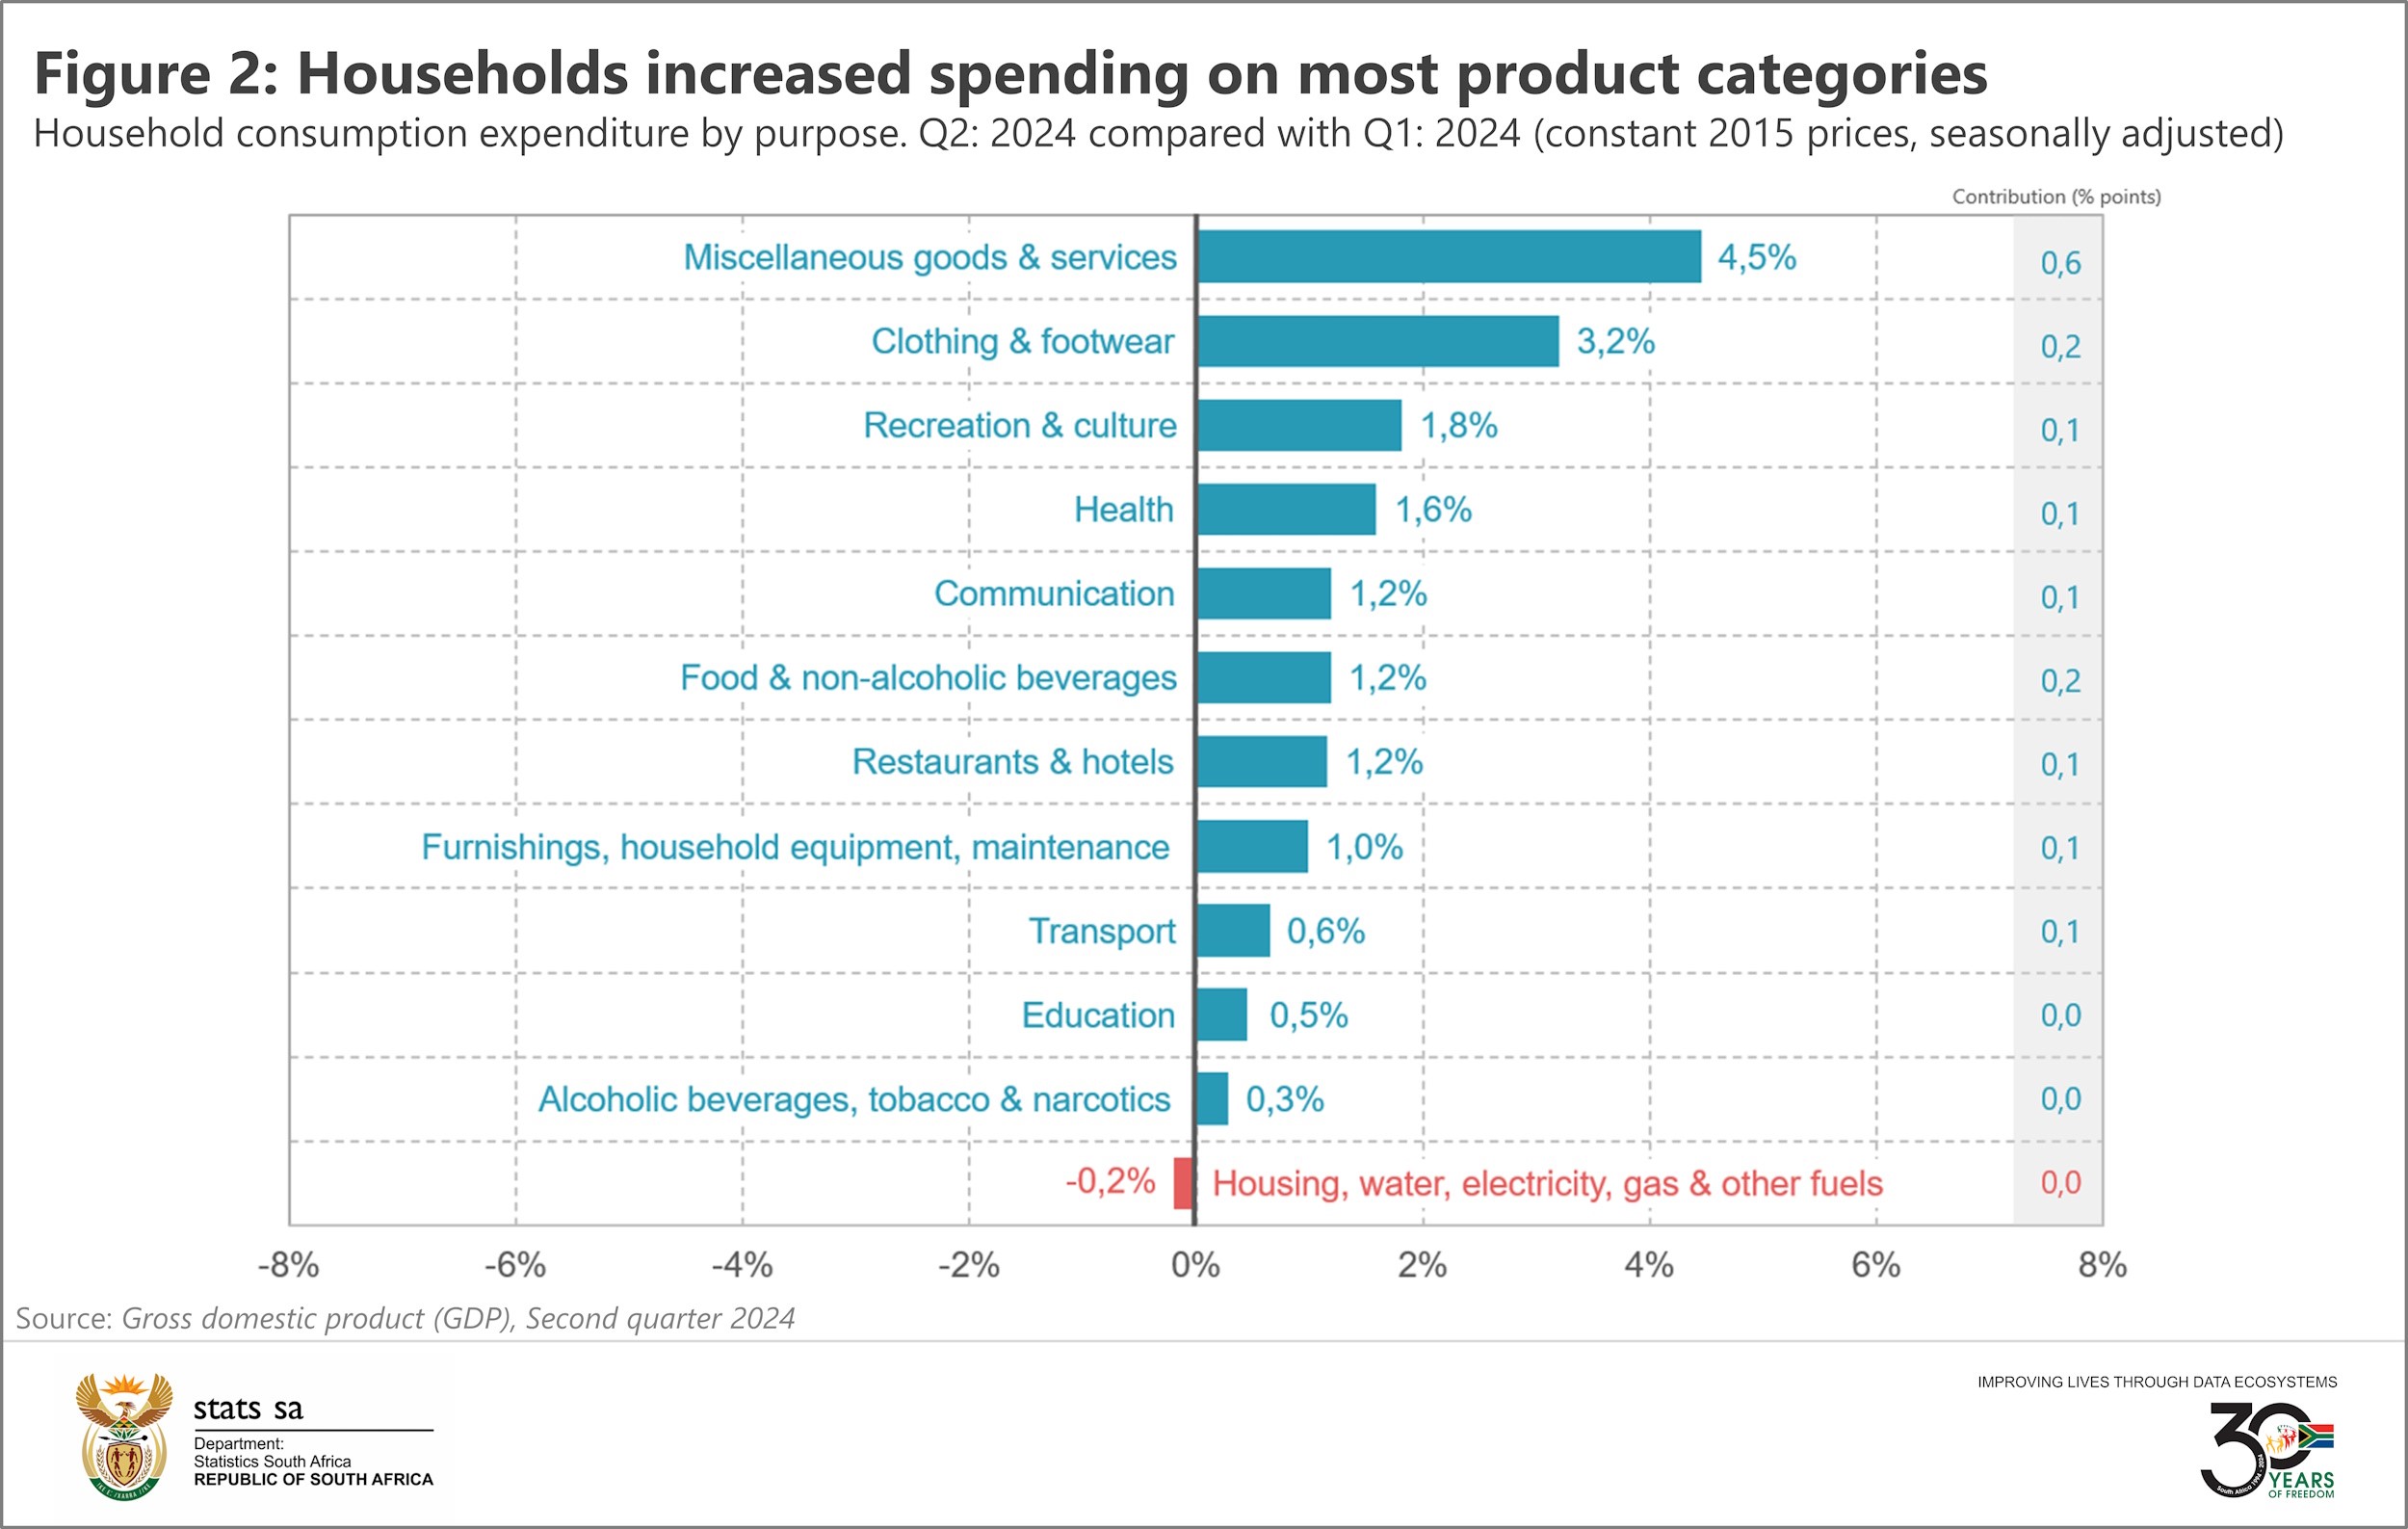
On the expenditure (demand) side of the economy, rising consumer confidence saw household consumption expenditure strengthen by 1,4%. Consumers increased their spending across most product categories (Figure 2). The miscellaneous goods & services product group was the largest positive contributor, driven mainly by increased spending on insurance.
Household consumption was the largest positive contributor to overall growth on the expenditure side of the economy (Figure 3). Government consumption was also positive, helped by a rise in purchases of goods and services and an increase in compensation of civil servants.
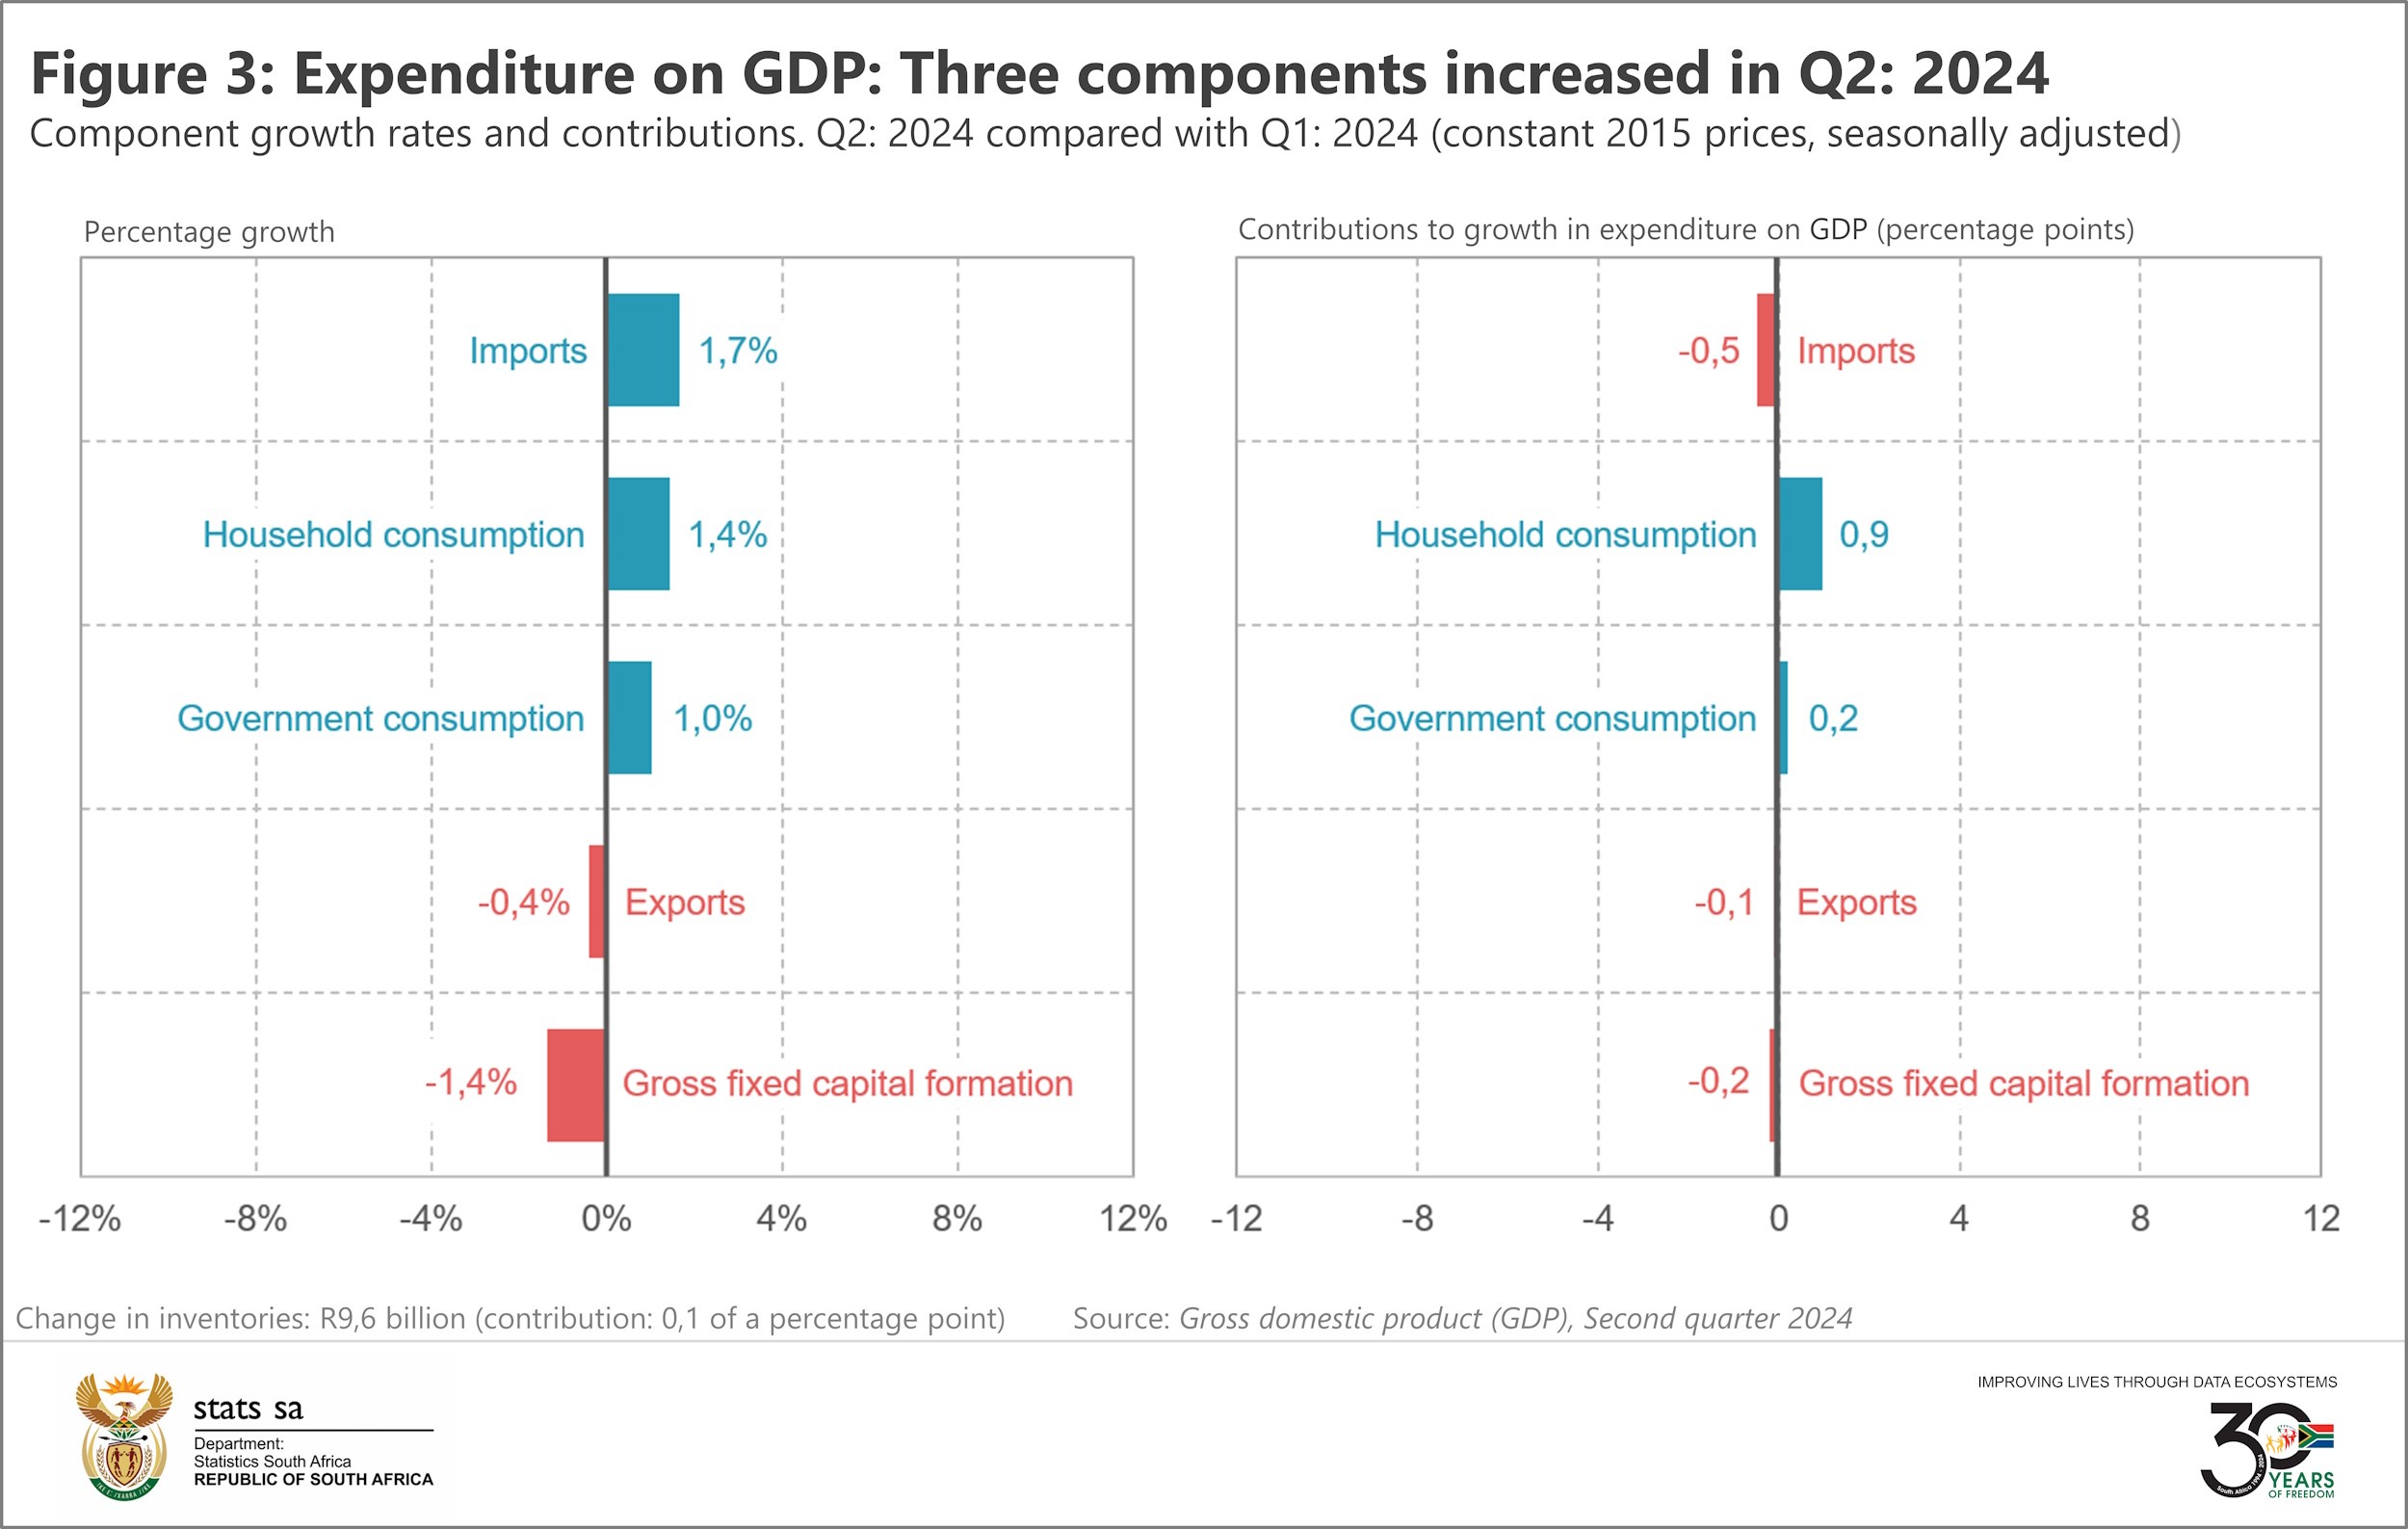
Imports rose by 1,7%. This was on the back of increased trade in vehicles and transport equipment (excluding large aircraft), vegetable products, mineral products, and textiles and textile articles.
There was a R9,6 billion build-up in inventories in the second quarter. The supply of goods in the economy exceeded demand, prompting the trade, manufacturing and finance industries to place newly produced goods into inventories.
Gross fixed capital formation, which includes investments in infrastructure and other fixed assets, disappointed for a fourth consecutive quarter. The 1,4% decline in the second quarter was due to lower investments in computer software, biological assets, construction works, machinery & other equipment, and transport equipment.
Exports were lower because of weaker trade in vegetable products, mineral products, vehicles & transport equipment (excluding large aircraft), and base metals & articles of base metals.
For more information, download the latest GDP release, media presentation and Excel files here.
1 Unless otherwise specified, growth rates quoted in the article are quarter-on-quarter, seasonally adjusted and in real (volume) terms (constant 2015 prices).
2 The Outlier & EskomSePush (access loadshedding data here).
Similar articles are available on the Stats SA website and can be accessed here.
For a monthly overview of economic indicators and infographics, catch the latest edition of the Stats Biz newsletter here.