
Which EBAs receive the most revenue?
A picture can tell an intricate story. The graphic below speaks for 257 public institutions.
Figure 1 shows the distribution of revenue across South Africa’s extra-budgetary accounts and funds (EBAs). In the 2022/23 financial year, EBAs received or generated R390,2 billion in revenue, according to the latest data. EBAs play a significant role in the financial management of many countries, including South Africa. Forming an important part of the broader general government1, they provide services to the public on behalf of the state.
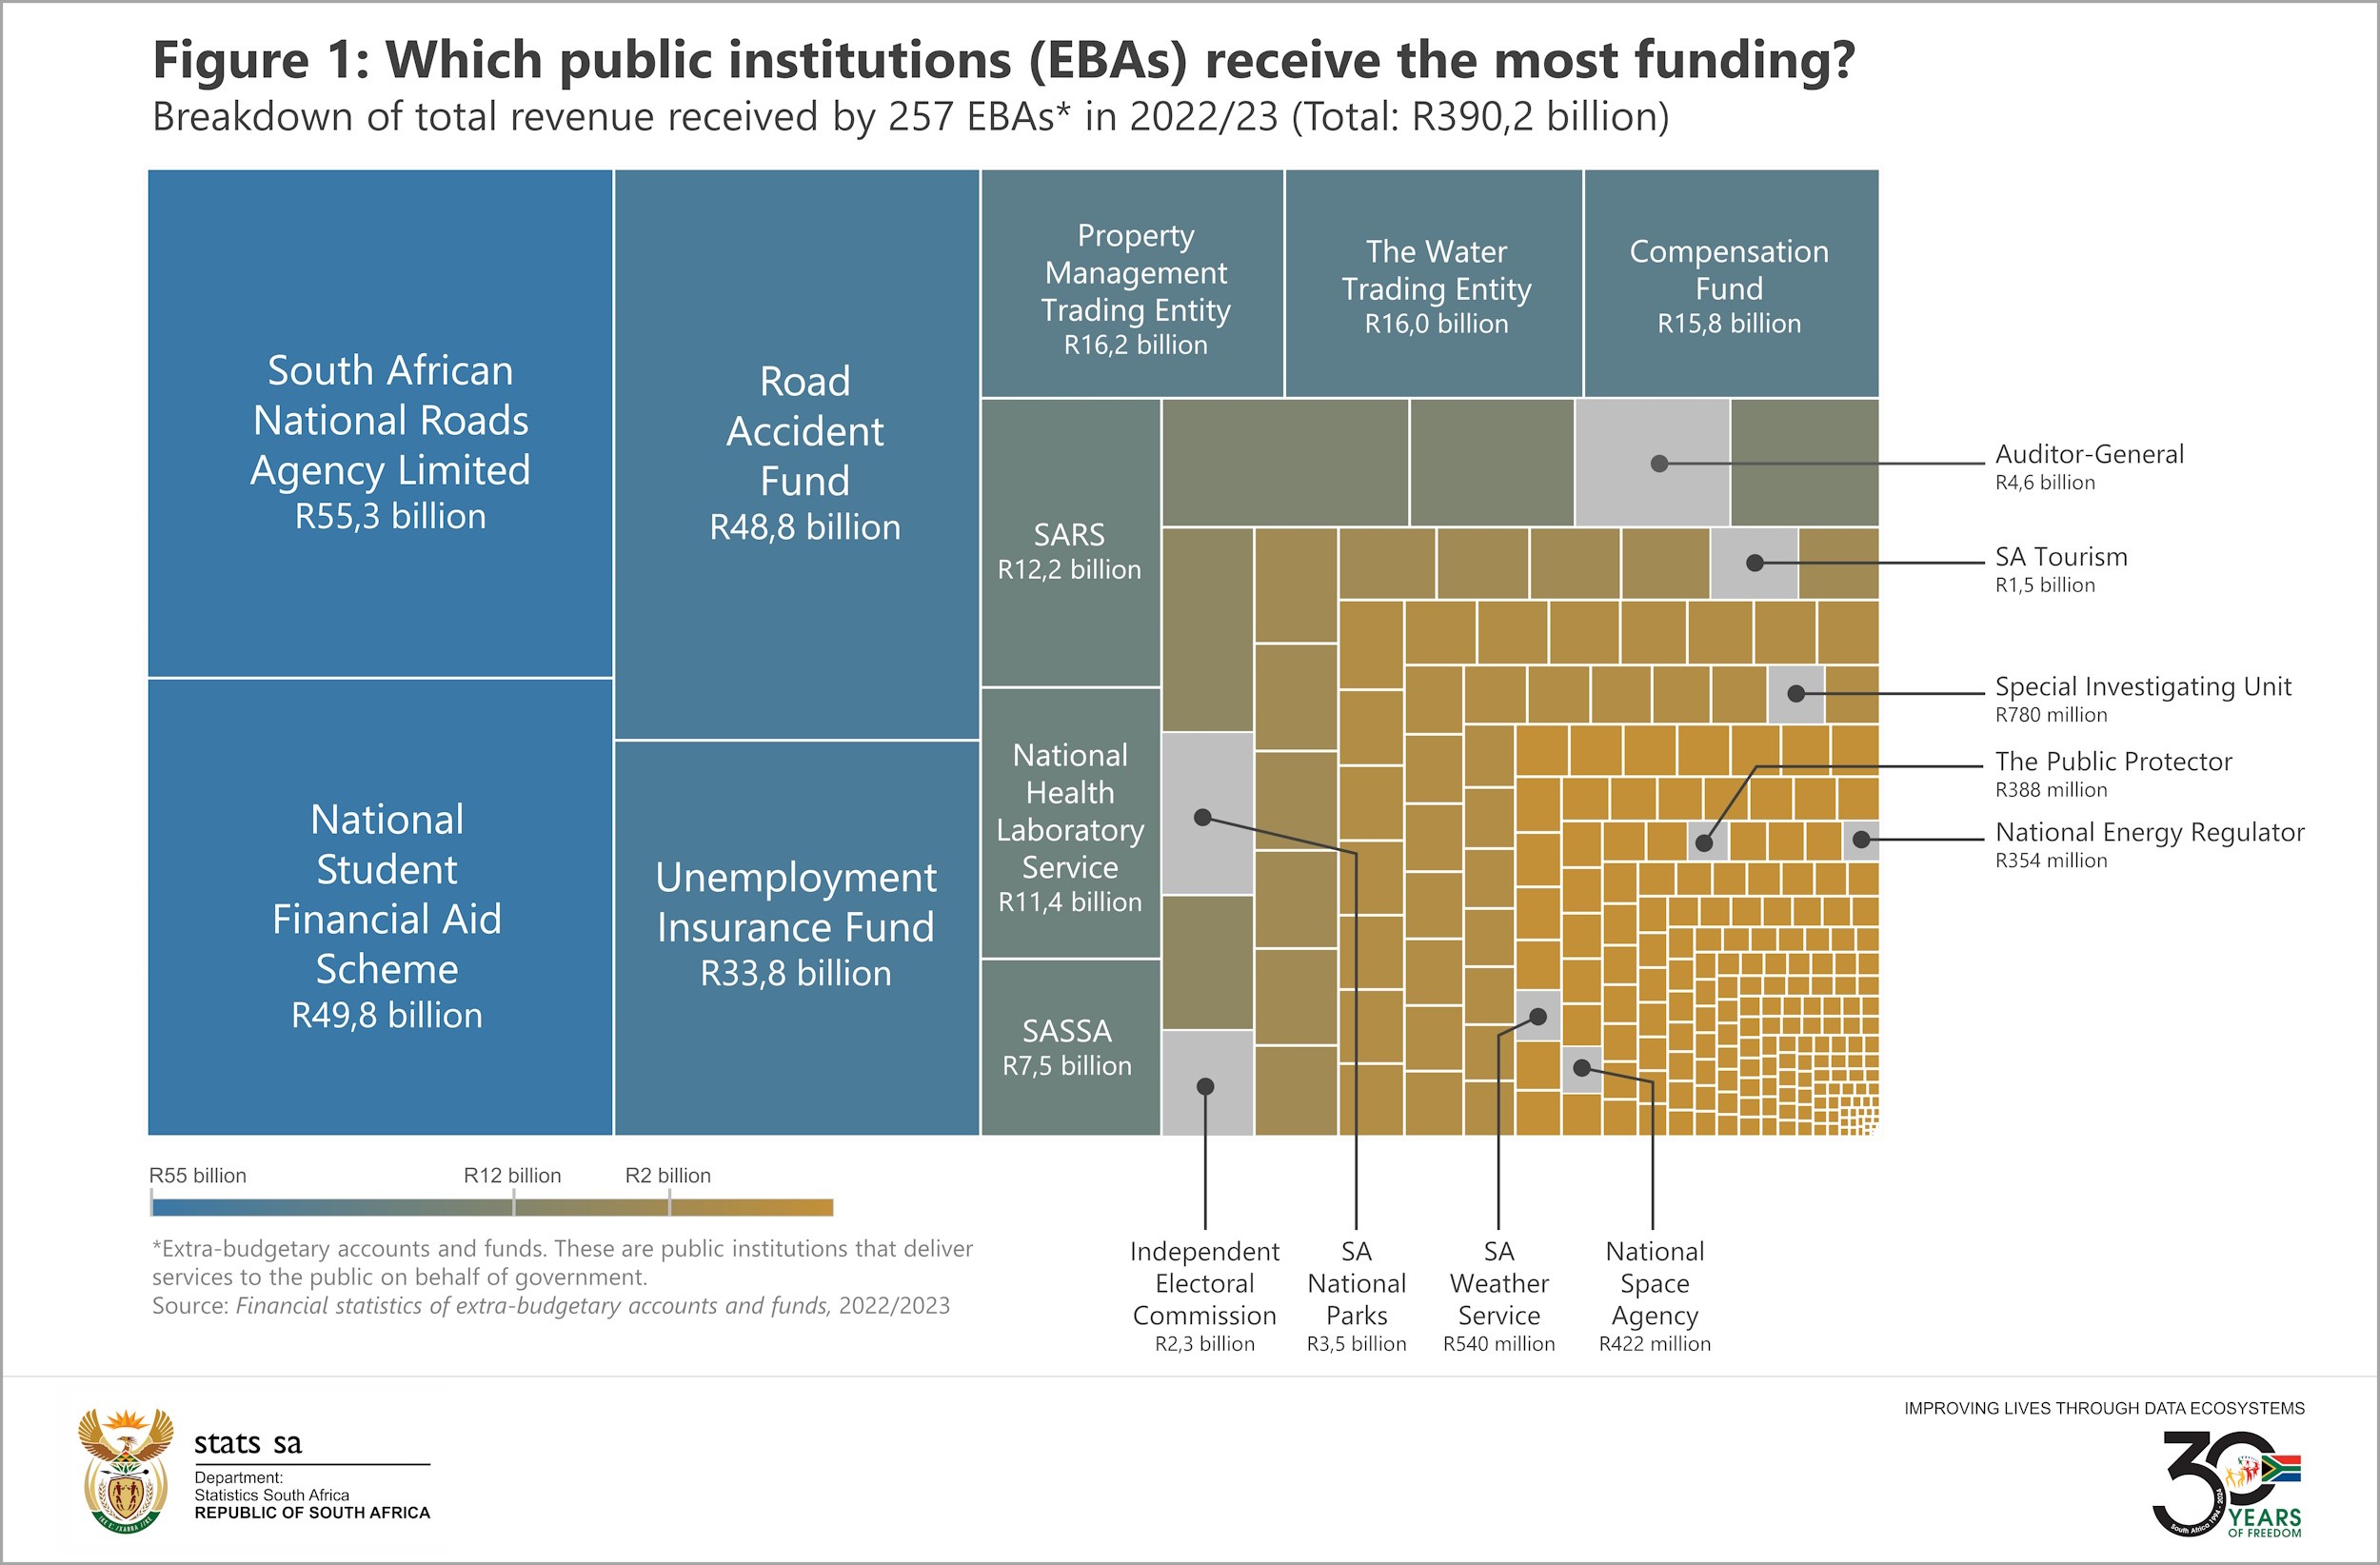
The South African National Roads Agency Limited (SANRAL) was the largest recipient, accounting for R55,3 billion (or 14,2%) of the total. A large portion (R46,6 billion) of SANRAL’s revenue was in the form of financial transfers from government (referred to as grants), with R23,7 billion as a special appropriation grant from the Department of Transport. This special grant – used specifically to pay off debts related to the organisation’s toll portfolio2 – contributed to the rise in SANRAL’s total revenue from R28,5 billion in 2021/22 to R55,3 billion in 2022/23.
Other big players in terms of revenue in 2022/23 included the National Student Financial Aid Scheme, the Road Accident Fund, the Unemployment Insurance Fund, and the Property Management Trading Entity.
Several EBAs generate their own revenue. However, as in the case of SANRAL, most EBAs receive funding via grants from national and provincial government departments. Grants accounted for almost half of total EBA revenue in 2022/23. Other forms of revenue include taxes collected, social contributions and ‘other’ receipts, such as sales of goods & services and interest received.
Moving on to expenses, purchases of goods and services accounted for just over a third of total EBA spending in 2022/23 (Figure 2).
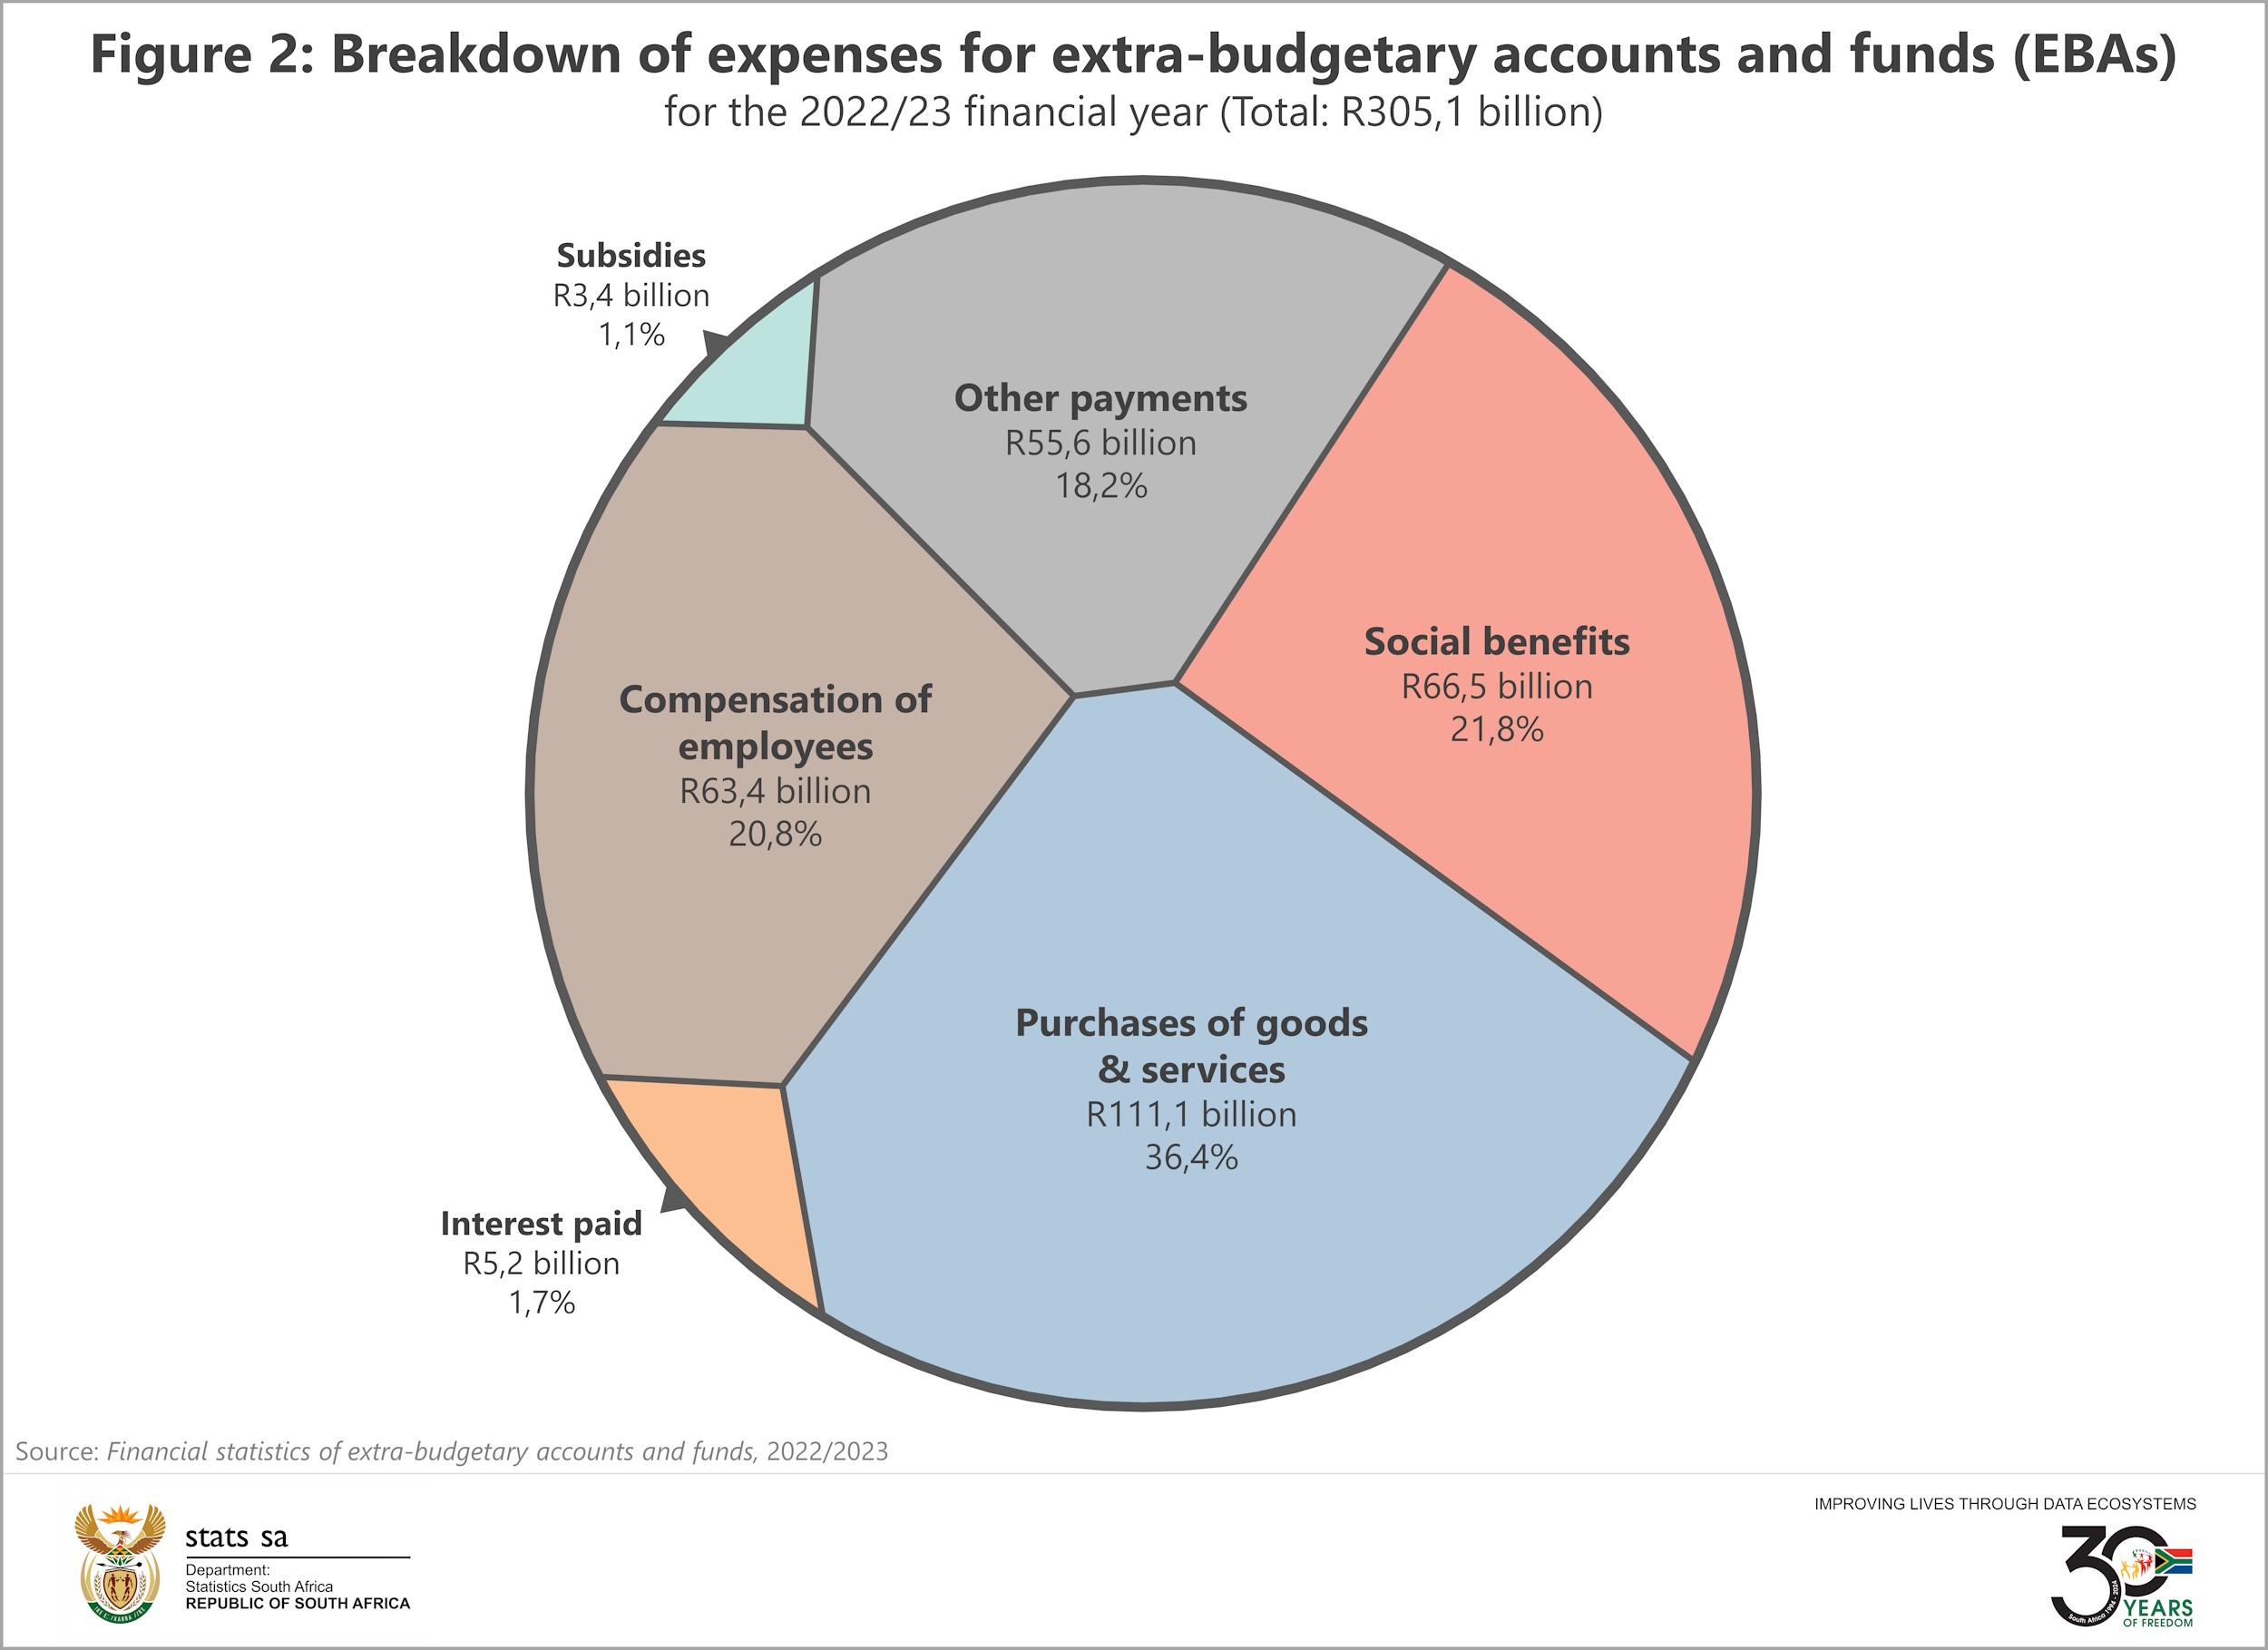
There was a 16% increase in purchases of goods and services between 2021/22 and 2022/23. This was mainly associated with a rise in payments for repairs and maintenance, advertising, as well as administration costs by SANRAL.
The second largest expense item in 2022/23 was social benefits, accounting for 21,8% of the total. Social benefits are transfers in cash or in-kind to the public. These help to diminish the impact of social risks, such as unemployment, sickness, disability and injury.
The category ‘other payments’, contributing 18,2%, primarily consists of transfers to households. This mainly includes spending by the National Student Financial Aid Scheme (NSFAS). The NSFAS receives most of its funds from the Department of Higher Education and Training for the purpose of providing financial aid to eligible students at public universities and Technical and Vocational Education and Training (TVET) colleges.
For more information, download the Financial statistics of extra-budgetary accounts and funds statistical release here.
1 The general government comprises national, provincial, local, extra-budgetary accounts & funds and institutions of higher learning. Stats SA publishes a range of government financial reports. The national government report for 2022/23 is available here. The reports that will be published later in the year are for provincial government and higher education institutions. A consolidated release, which incorporates data from all these publications, will be available in November.
2 SANRAL, Integrated Report 2022/2023, Volume 1, page 28 (view here).
Similar articles are available on the Stats SA website and can be accessed here.
For a monthly overview of economic indicators and infographics, catch the latest edition of the Stats Biz newsletter here.