Gender Gaps Persist in SA Labour and Leadership Roles
This year’s Women’s Month, marked by the theme “Celebrating 30 Years of Democracy Towards Women’s Development,” serves as a powerful reminder of the strides women have made since the dawn of our democracy. The theme not only highlights the achievements and contributions of women across various sectors but also underscores the ongoing challenges that need to be addressed to ensure gender equality.
While women’s empowerment remains a key priority on the global development agenda and is crucial for achieving gender equality, a new report by Statistics South Africa titled Gender Series Volume XI: Women Empowerment, 2014–2024, reveals disparities in the labour market. According to the report, women in South Africa are more likely to face unemployment and are less likely to participate in the workforce compared to men.
Economic empowerment is a cornerstone of achieving gender equality, yet significant gaps that hinder progress remain. In South Africa, women continue to face challenges in accessing economic opportunities, despite policies aimed at promoting inclusion.
South Africa’s working-age population grew by nearly 6 million, increasing from 35,3 million in Q2:2014 to 41,3 million in Q2:2024. Despite this rise, gender disparities in the working-age population remained relatively stable across provinces over this period.
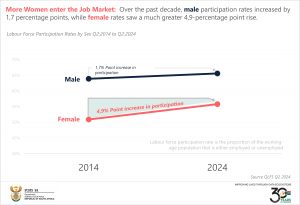
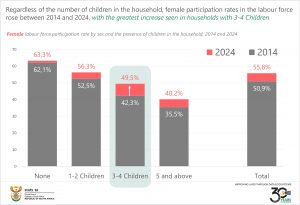
The proportion of working-age males rose slightly from 49,2% in Q2:2014 to 49,6% in Q2:2024, while the percentage for females dropped from 50,8% in Q2:2014 to 50,4% in Q2:2024. By Q2:2024, the labour force participation rate1 for men stood at 65,6%, compared to 55,8% for women. Over the past decade, male participation rates increased by 1,7 percentage points, while female rates saw a 4,9-percentage point rise.

The lowest participation rates in Q2:2024 were found among those with five or more children, with 42,0% for men and 40,2% for women.
National employment rates declined from 42,7% in Q2:2014 to 40,3% in Q2:2024, with male employment consistently outpacing female employment. Male employment fell from 48,7% in Q2:2014 to 44,9% in Q2:2024, while female employment saw a slight decrease from 36,9% in Q2:2014 to 35,8% in Q2:2024. However, there was a 7,4-percentage point increase in the number of women with tertiary qualifications employed in physical/mathematics and engineering fields, rising from 22,2% in Q2:2014 to 29,6% in Q2:2024. Moreover, women were increasingly entering traditionally male-dominated fields, as indicated by the growing gender parity ratio in Arts and Economic and Management Sciences.
Self-employed women were more likely to be in the informal sector, while self-employed men were predominantly in the formal sector. An analysis of business size revealed that men were more likely to own companies with 20 or more employees, while women were more likely to operate as sole proprietors.
Unemployment rates surged from 25,5% in Q2:2014 to 33,5% in Q2:2024, with Limpopo, North West, and Eastern Cape experiencing the most significant increases. The Western Cape and Northern Cape were the only provinces to see a decline.
The highest unemployment rates were among individuals aged 25–34, with women facing higher rates than men. Among those with five or more children, the unemployment rate for men was 49,6% in Q2:2024, while women stood at 56,7%.
The percentage of female-headed households relying on salaries as their main income source increased from 32,4% in 2014 to 36,1% in 2023, while those dependent on grants decreased from 63,3% in 2014 to 58,0% in 2023. Women were more likely than men to receive grants in 2023, particularly in rural areas, where 47,2% of women received grants compared to 23,1% in urban areas.
“Leaving no one behind” requires tackling multiple and intersecting forms of discrimination and inequality. Achieving gender equity in decision-making roles—in both government and the private sector—is essential for empowering women with responsibilities in planning, policy-making, and coordinating empowerment initiatives.
Management positions in the public sector are still predominantly held by men, although female representation has improved, especially in middle management. The percentage of women in middle management (MMS) positions rose from 45,2% in 2019 to 46,4% in 2023, while senior management (SMS) roles saw an increase from 42,4% to 45,2% over the same period. Younger women (aged 35 or under) are more likely to hold MMS and SMS positions than their male counterparts.
Significant strides have been made toward gender equality in politics, particularly in parliament, where female representation has grown since 2004. Women’s representation in parliament increased from 33,0% in 2004 to 42,8% in 2024, while in the National Council of Provinces (NCOP), it rose from 41,0% to 44,4% over the same period. Although the cabinet achieved gender parity in 2019, female representation decreased to 43,8% in 2024.
At the local government level, decision-making positions such as mayors and municipal councillors remain male-dominated. In 2022, only 32,0% of mayoral positions were held by women, compared to 68,0% by men. The Eastern Cape (54,0%), North West (50,0%), and Free State (48,0%) have the highest representation of female mayors. Municipal councillor positions are also male-dominated, with women occupying just 37,7% of these roles. The Free State and KwaZulu-Natal report the lowest representation of female councillors, at 32,9% and 33,1% respectively.
For more information on women empowerment, download the full report here.
1 The labour force participation rate is a measure of the proportion of a country’s working-age population that engages actively in the labour market, either by working or looking for work (https://ilostat.ilo.org/methods/concepts-and-definitions/description-labour-force-statistics/)


