
Consumer inflation sinks below 5%
After holding steady for ten months in the 5–6% range, annual consumer price inflation slowed to 4,6% in July from 5,1% in June. The July inflation print is the lowest in three years since July 2021, when the rate was also 4,6%. Lower annual rates were recorded for several product groups, most notably food & non-alcoholic beverages (NAB), transport, and housing & utilities.
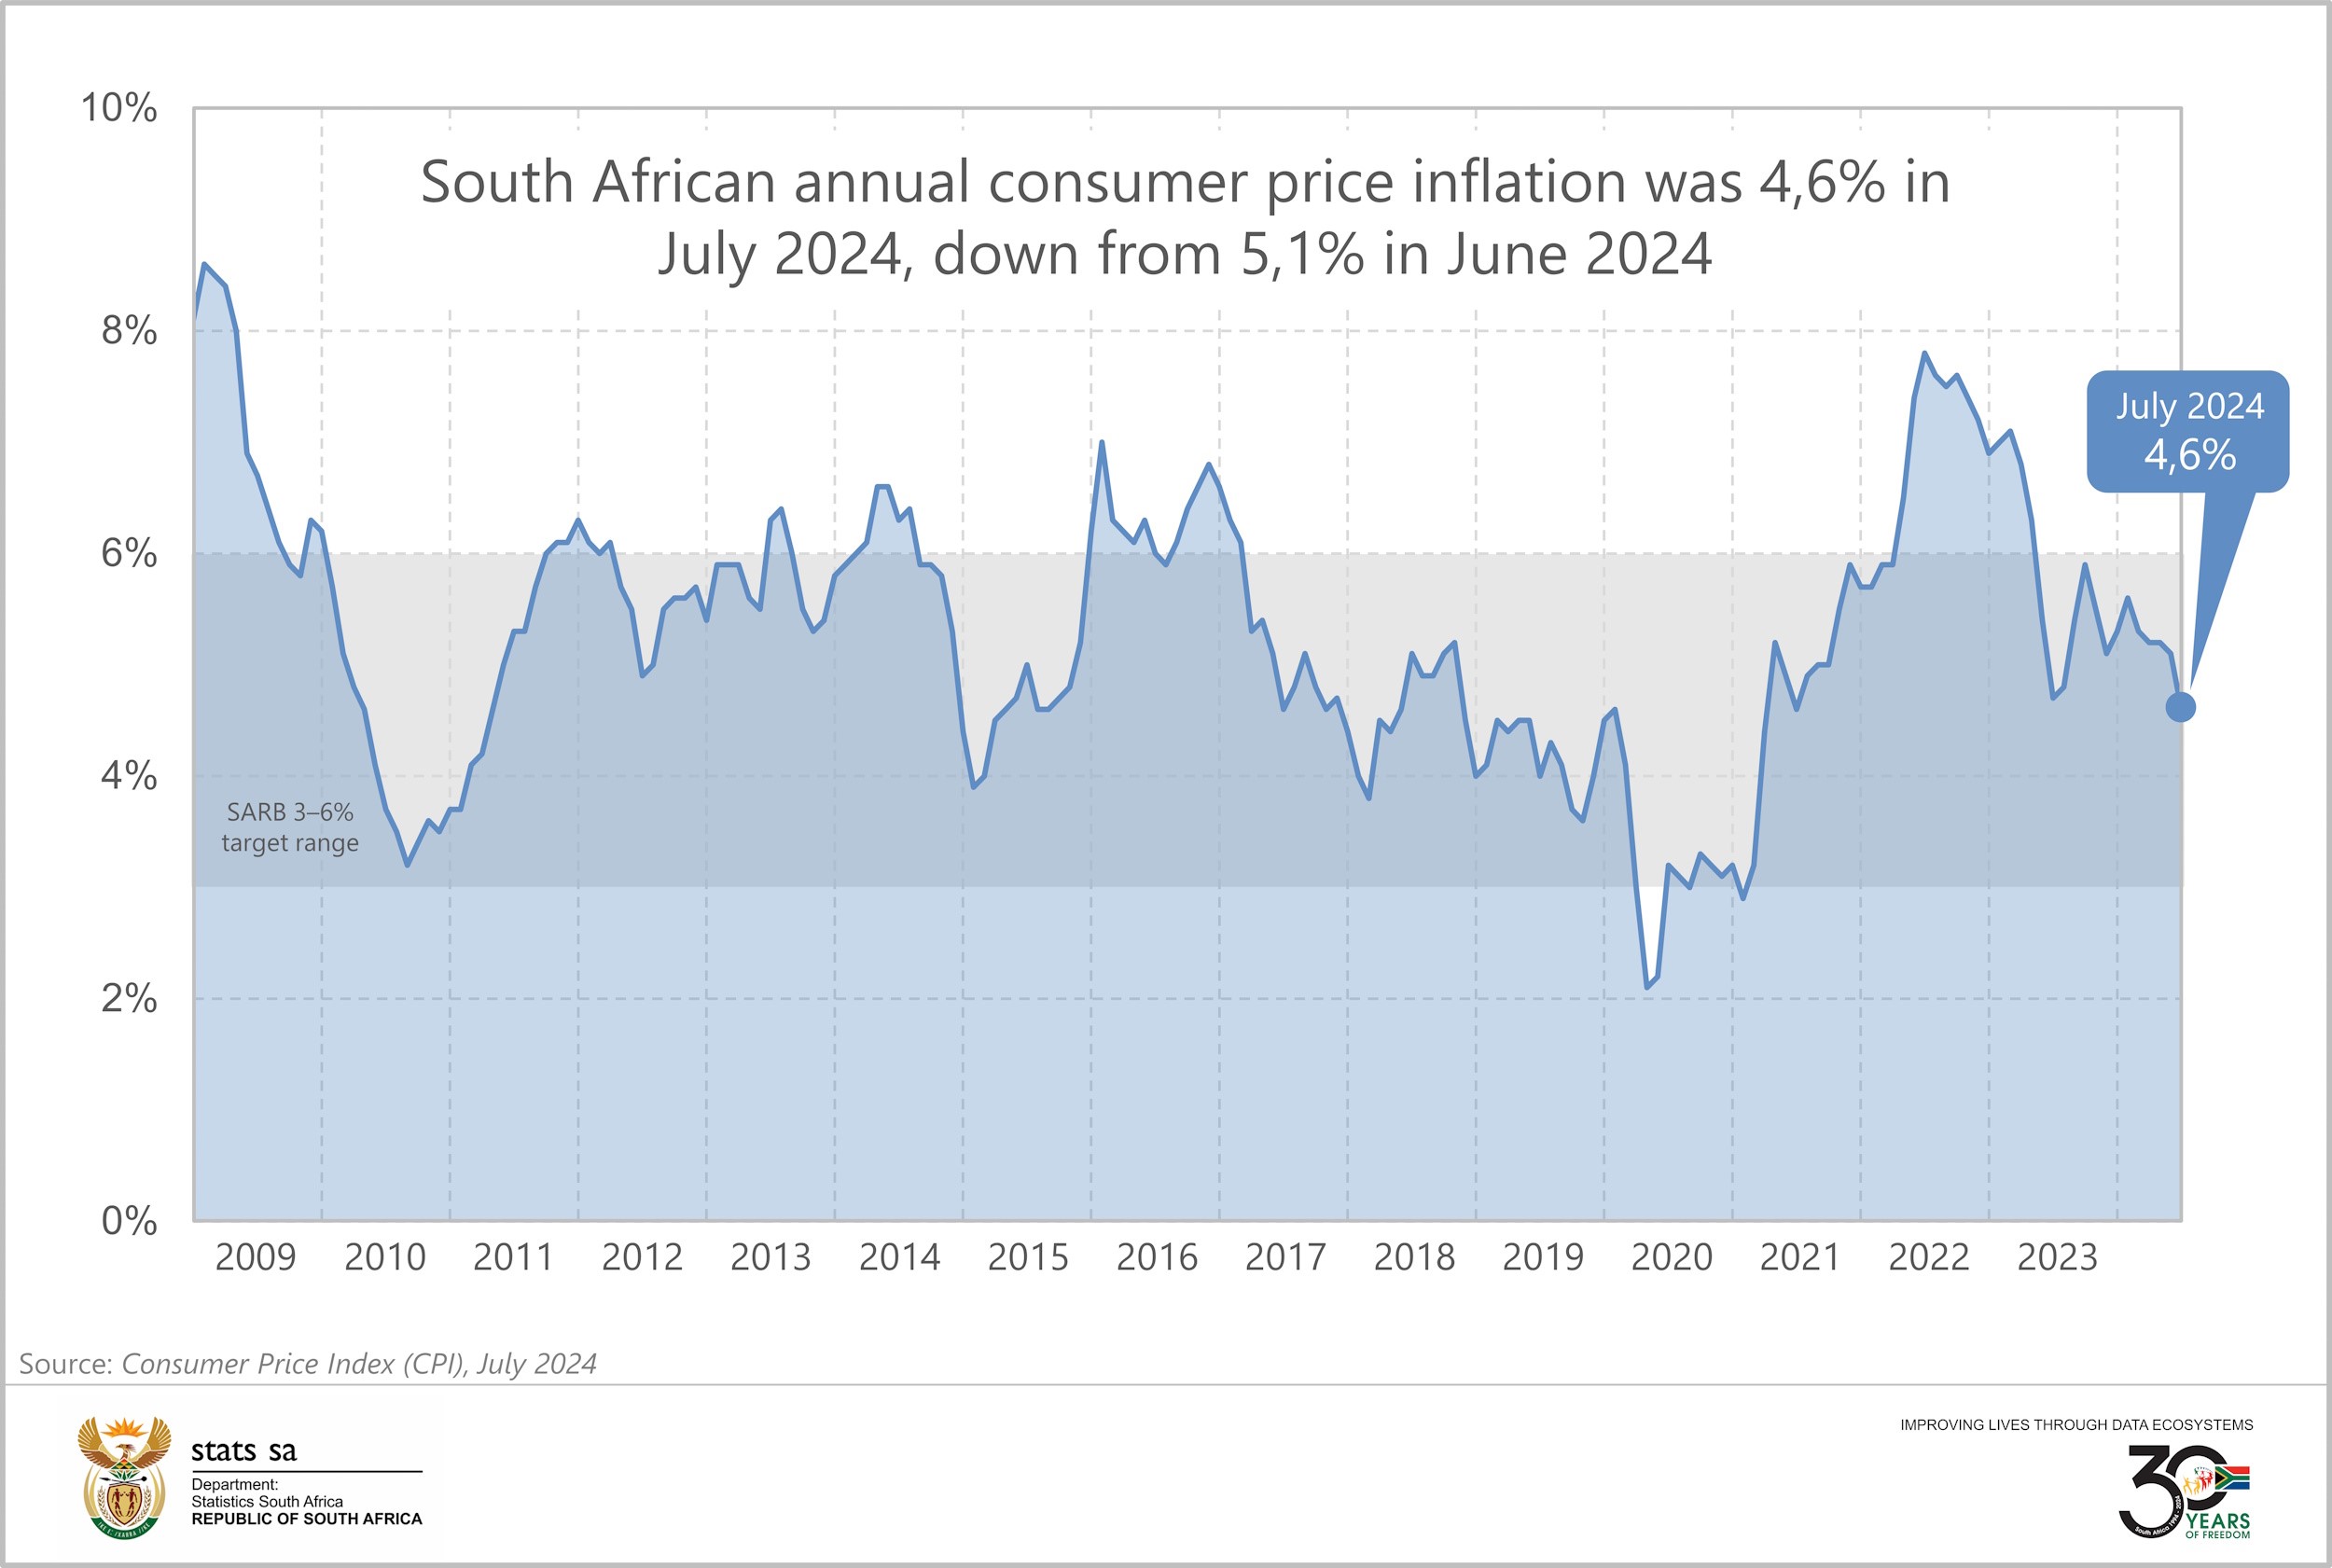
The monthly increase in the consumer price index (CPI) was 0,4%, higher than the 0,1% rise recorded between May and June.
Food inflation dips further.
The annual rate for food & NAB was 4,5% in July, down from 4,6% in June. Food & NAB registered a slowing inflation trend since its most recent high of 9,0% in November 2023 and is currently at its lowest since September 2020 (3,8%).
While overall food inflation has slowed, bread & cereals is showing upward momentum. The category recorded an annual increase of 5,6% in July, up from June’s 5,2%. Products with the largest annual increases in July include rice (up 21,3%), pizza or pies (up 11,6%) and samp (up 6,9%). Maize meal prices rose on average by 5,1%. On a positive note, bread flour, cake flour, pasta and macaroni are cheaper than a year ago.
Meat is the most heavily weighed food group in the inflation basket, taking up just over a third of household spending on food. The price index for meat recorded a monthly decline of 0,4% and an annual rise of 1,0%.
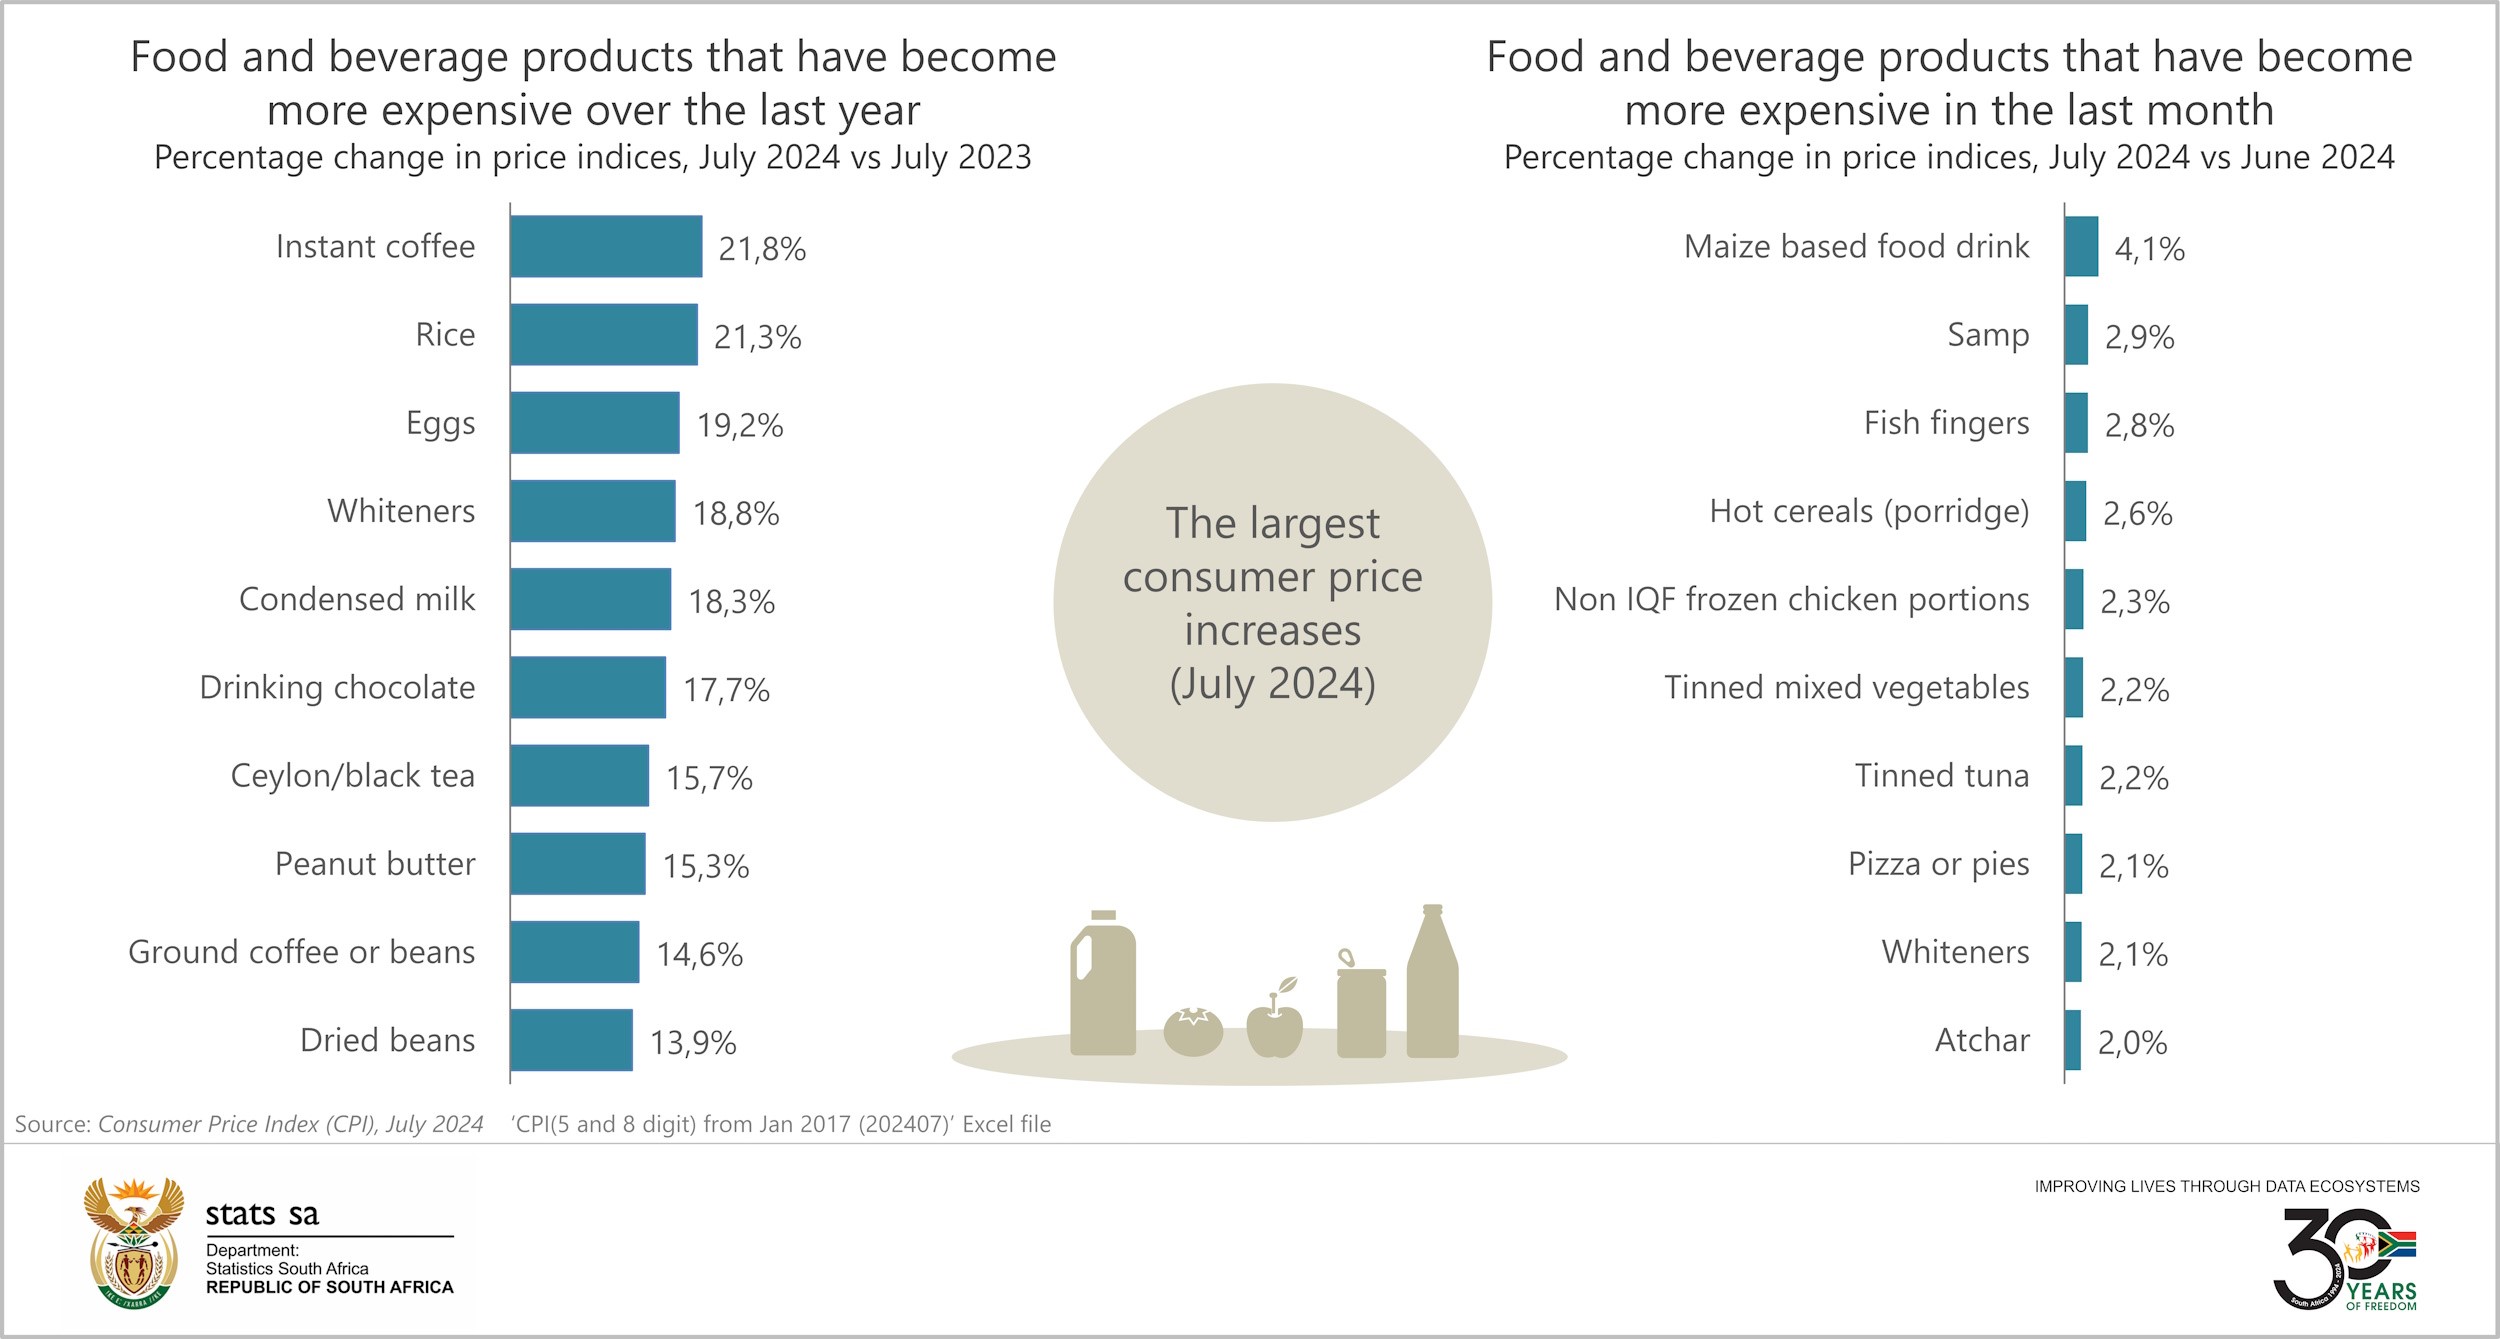
Hot beverages continue to witness high inflation rates. The price index for the category increased sharply by 17,6% in the 12 months to July, up from 16,5% recorded in June. Large annual price increases were recorded for instant coffee (up 21,8%), drinking chocolate (up 17,7%), black tea (up 15,7%), ground coffee and coffee beans (up 14,6%) and rooibos tea (up 11,1%). Cappuccino sachets recorded the lowest price increase in this category, rising by 7,6% over the same period.
The graphs below show food and beverage products that recorded the most significant annual and monthly price increases in July.
Fuel prices decline for a second consecutive month
Except for public transport, most categories in the transport group witnessed lower annual rates. This includes new and used vehicles, running costs and fuel. As a result, annual transport inflation softened to 4,2% in July from 5,5% in June.
Fuel prices receded for a second straight month, declining by 3,6% in July. This followed a 4,6% decrease in June. Inland 95-octane petrol was 99c cheaper, falling from R24,25 in June to R23,26 in July.1 The average price for diesel declined by 41c over the same period, from R23,76 to R23,35.2
New data for electricity, water and property rates
Most municipalities implement tariff increases in July. Overall, the housing & utilities index increased by 2,6% between June and July, leading to an annual increase of 5,3%. This contributed 1,3 percentage points to the overall inflation rate.
Tariff hikes were lower in 2024. Electricity tariffs increased by 12,1% (compared with 15,3% in 2023), water tariffs by 7,5% (compared with 9,6% in 2023) and property rates by 10,7% (compared with 8,4% in 2023).
An exploration of tariffs over time shows electricity prices rising the fastest over the last 15 years. Electricity tariffs recorded an average growth rate of 10,5% per year from 2009 to 2024, outpacing water tariffs (up by an average of 10,2% per year) and property rates (up by an average of 6,8% per year).
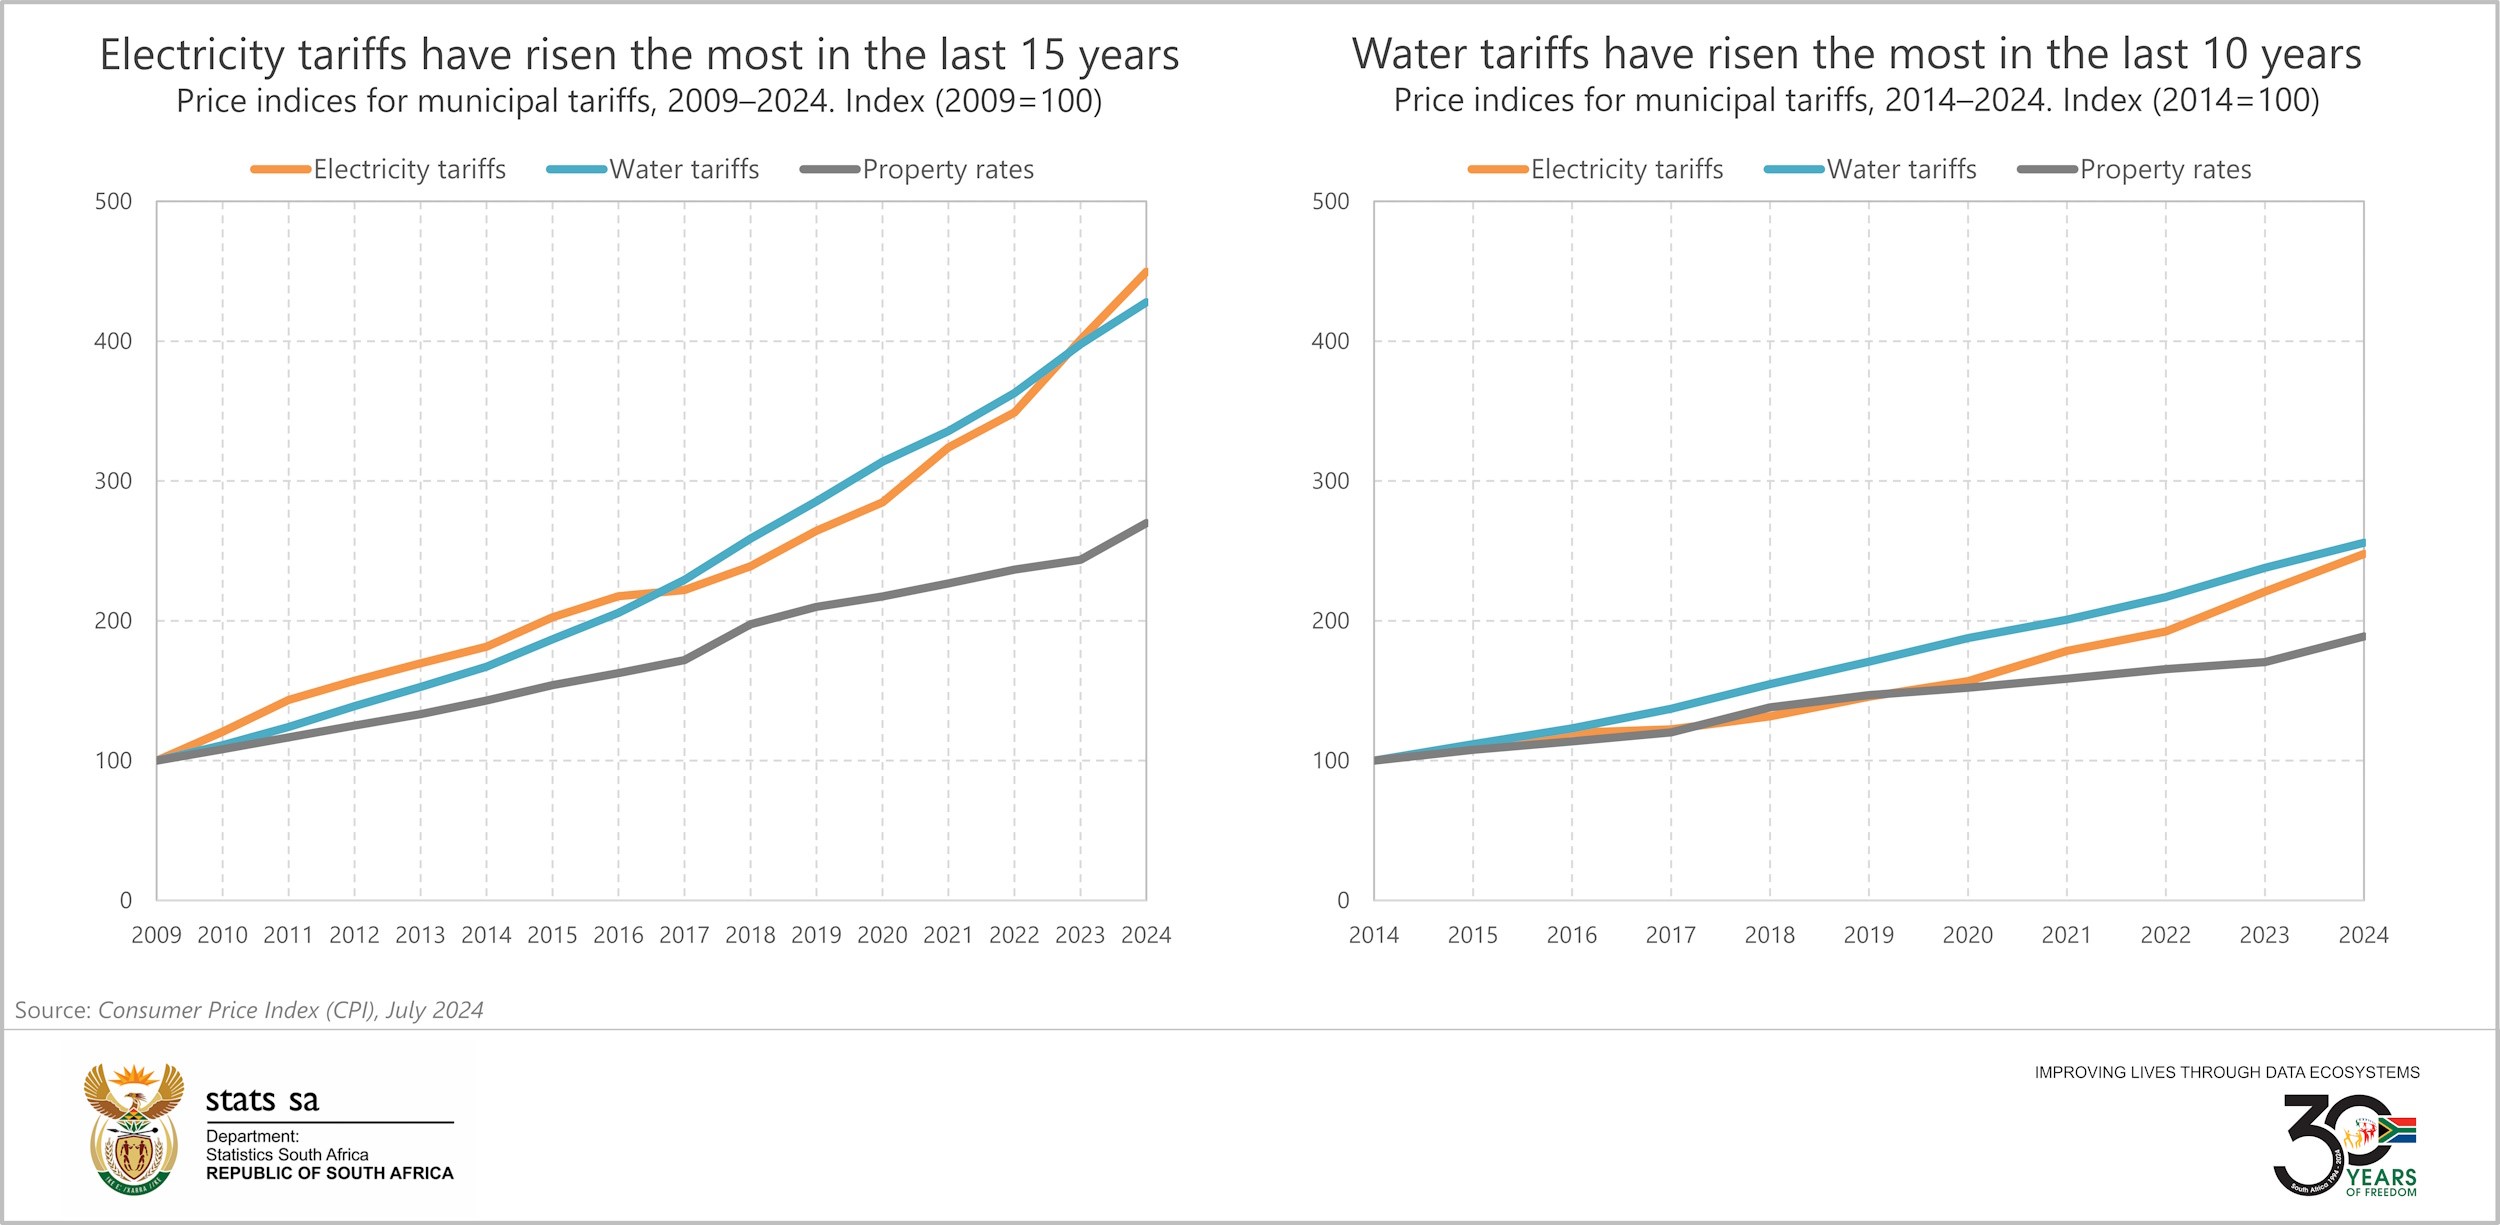
In the last 10 years, water tariffs have risen the most, increasing by an average of 9,9% per year. Electricity tariffs increased by an average of 9,5% per year, and property rates by an average of 6,6%.
A five-year analysis of the data, from 2019 to 2024, shows electricity tariffs outpacing water and property rates, growing by an average of 11,2% per year.
Stats SA surveys electricity, water and property rates across 39 municipalities, totalling 117 prices. The bulk of these were captured in July, with 10 prices – mainly from smaller municipalities – due to be surveyed in August.
For more information, download the July 2024 CPI statistical release and Excel files with indices and average prices here. The archive is available here.
1 Department of Mineral Resources and Energy. Comparing prices for petrol, diesel and illuminating paraffin (IP) (click here).
2 Stats SA, CPI_Average Prices_All urban(202407) Excel file.
Similar articles are available on the Stats SA website and can be accessed here.
For a monthly overview of economic indicators and infographics, catch the latest edition of the Stats Biz newsletter here.