
Residential property price inflation on an upward trend
Stats SA has published monthly residential property price indices for provinces and metropolitan areas since March 2023. Here is a rundown of the latest inflation data for the housing market.
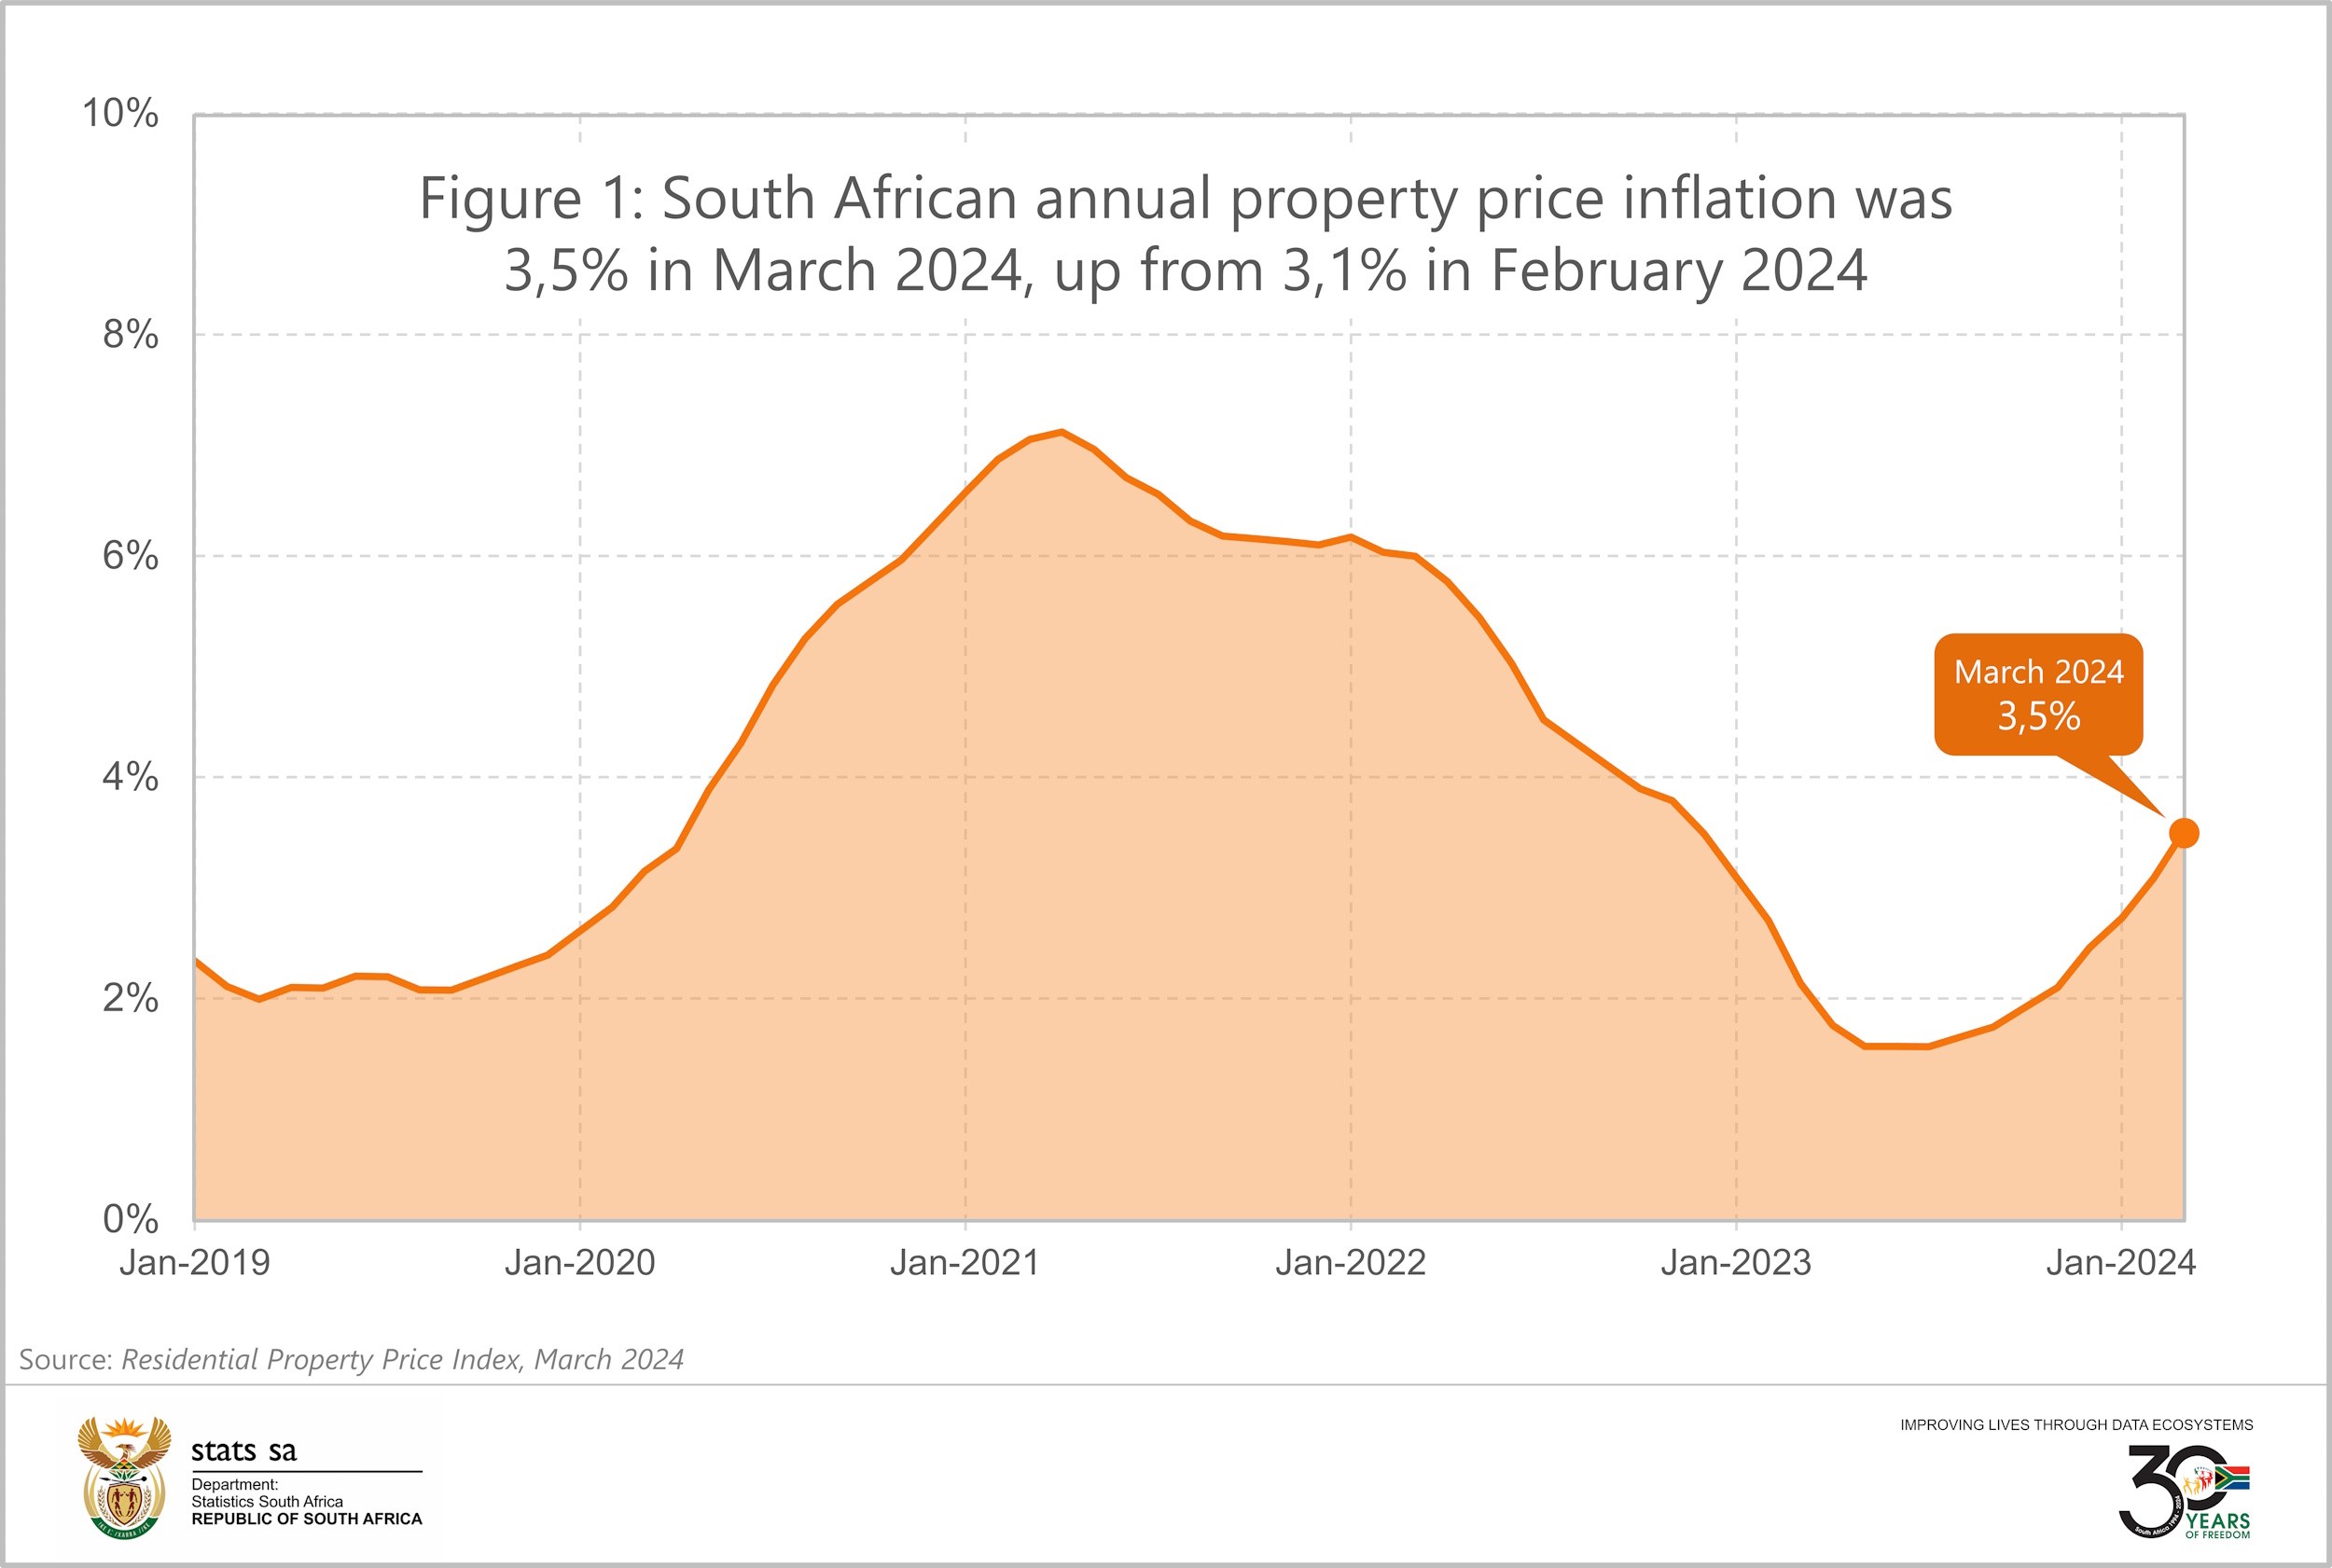
The Residential Property Price Index (RPPI) measures the change in prices for all dwellings, including houses, townhouses, and flats that are purchased by private individuals.1 The national RPPI increased by 3,5% in the 12 months to March 2024, up from a revised 3,1% in February 2024 (Figure 1). Residential property inflation has trended upwards since a low of 1,6% in May 2023.
Western Cape records the sharpest rise
Properties in Western Cape registered the largest price increases in March 2024 compared with March 2023, rising on average by 7,7% (Figure 2). North West recorded an increase of 5,0%, followed by Mpumalanga at 2,3%. On average, properties were cheaper in Northern Cape and Limpopo, with prices declining by 4,8% and 2,3% respectively. Gauteng saw a marginal 0,7% increase.
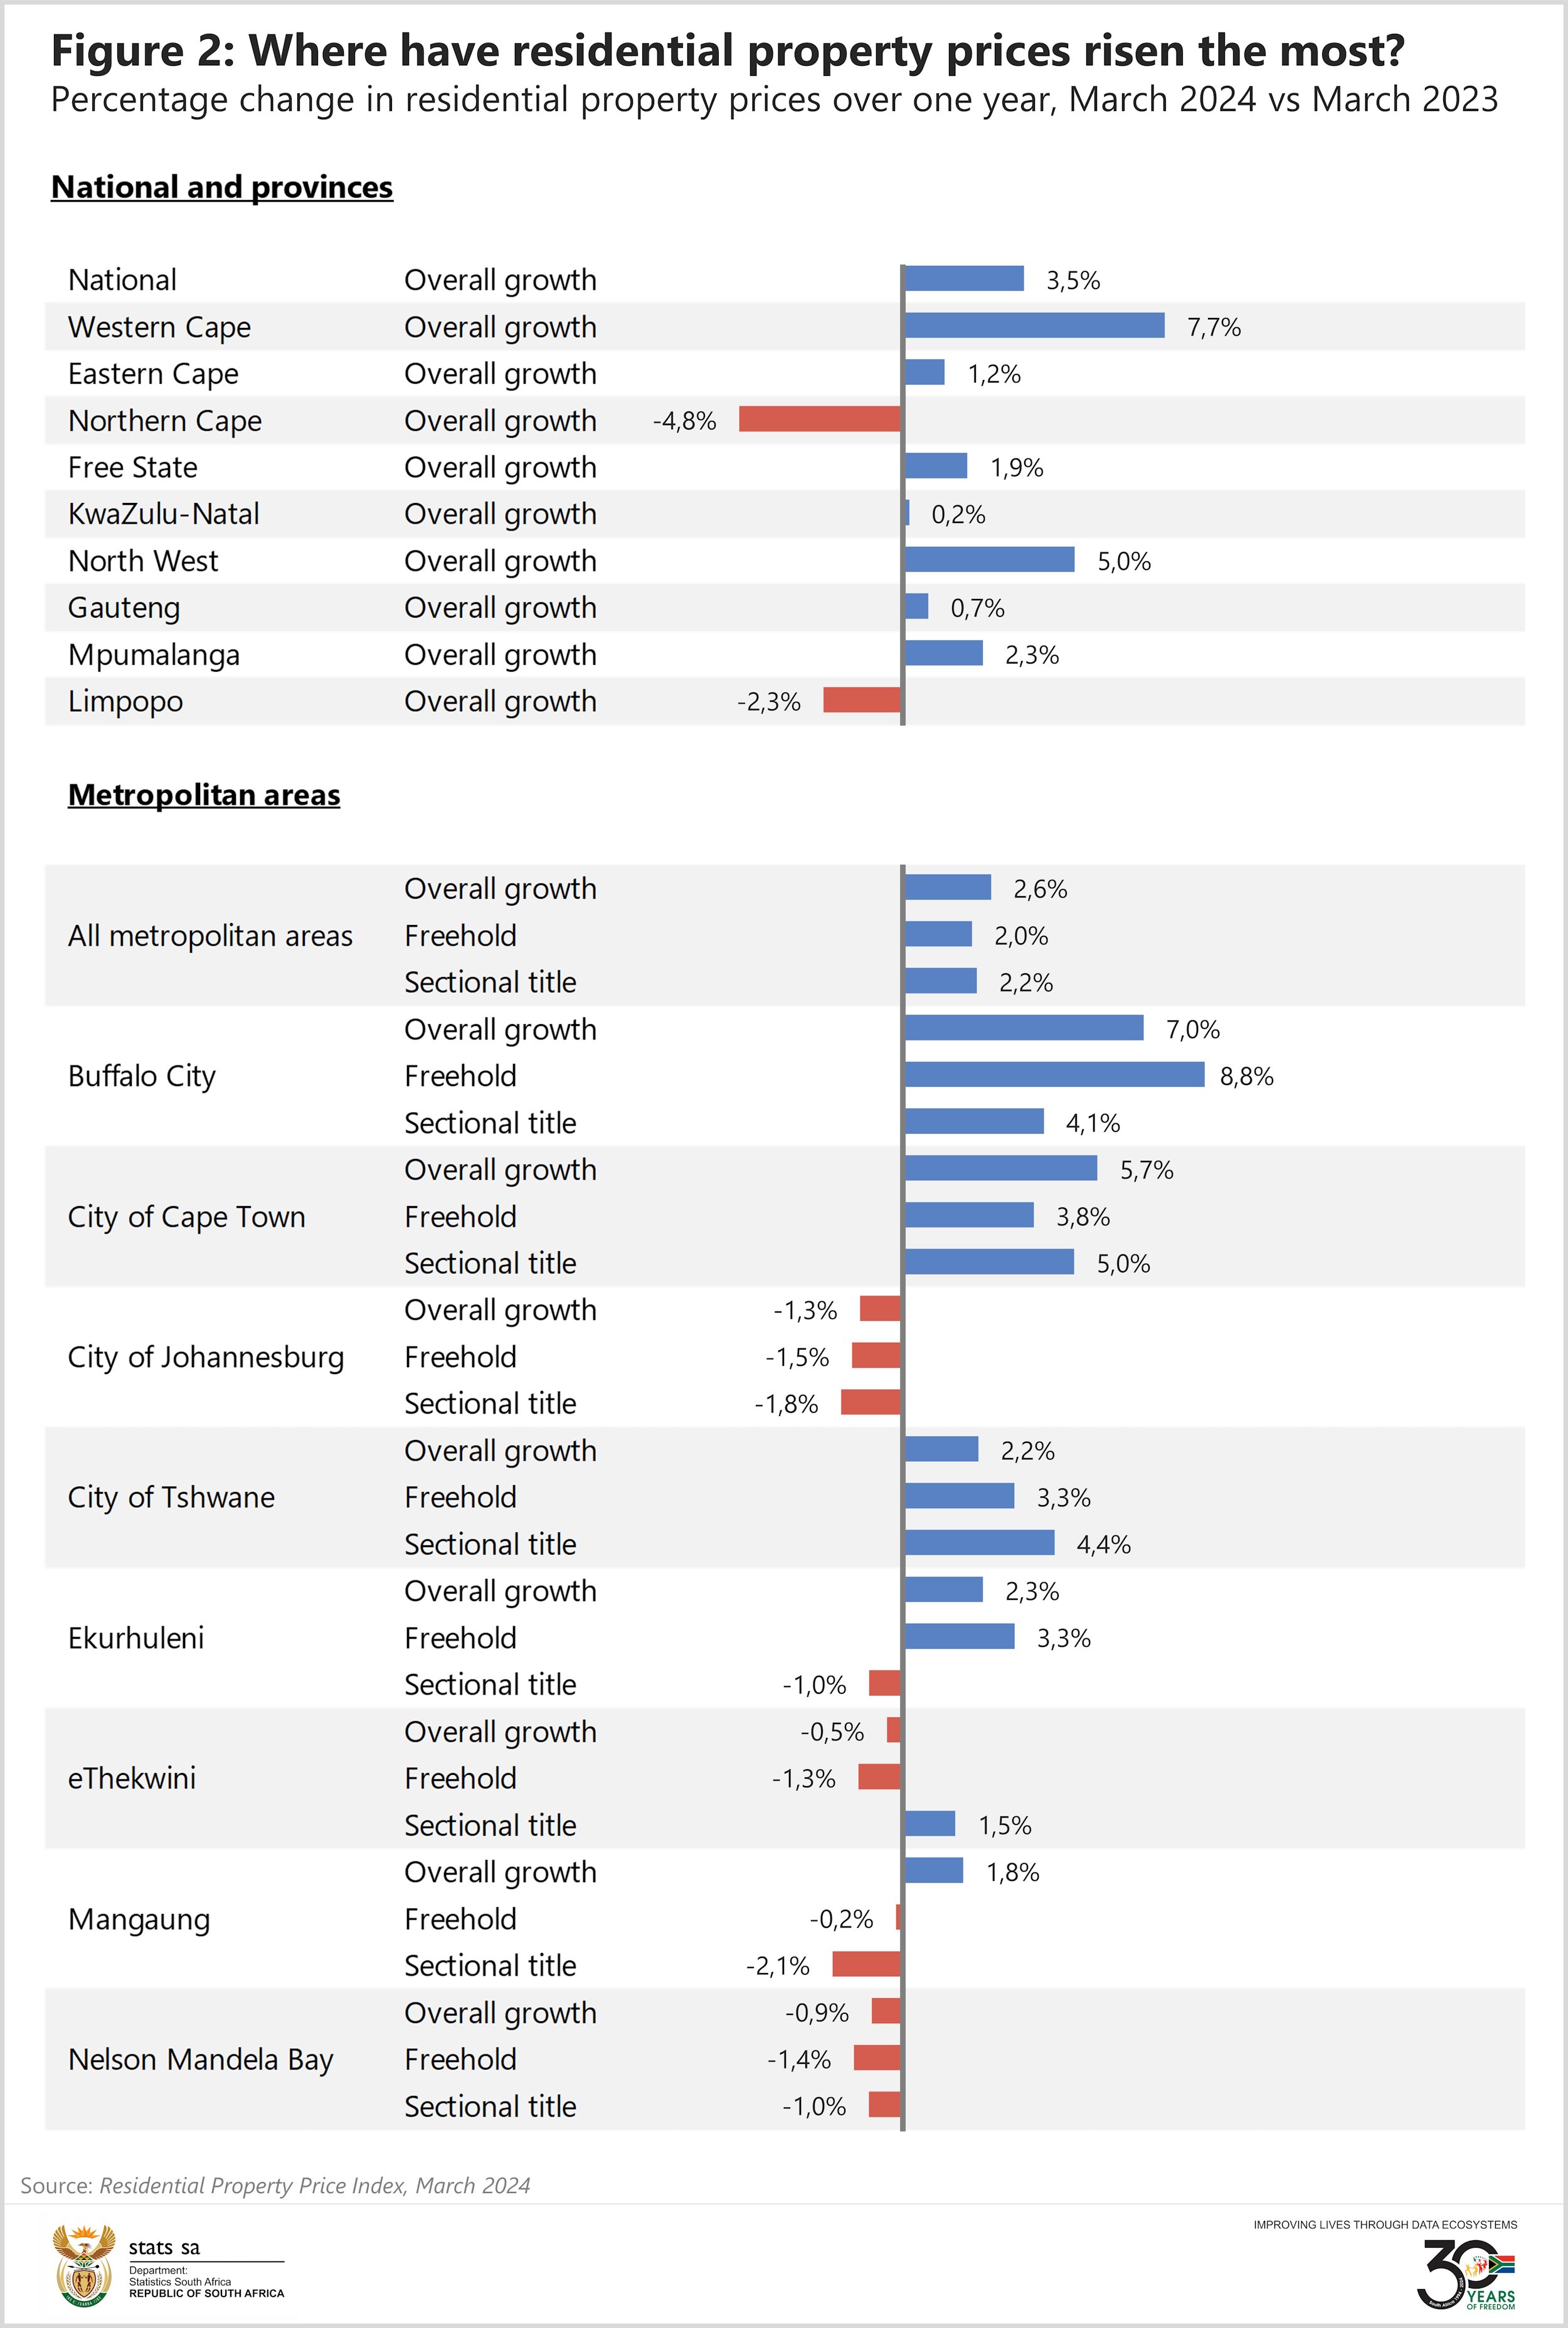
The RPPI statistical release provides data for South Africa’s largest cities. The RPPI for metropolitan areas increased by an annual rate of 2,6% in March, up from 2,1% in February. Buffalo City Metropolitan Municipality recorded the largest increase at 7,0%.
Residential properties in the City of Cape Town were 5,7% more expensive. In Gauteng, both Ekurhuleni and the City of Tshwane registered increases. However, prices in the City of Johannesburg cooled by 1,3%. Nelson Mandela Bay Municipality in Eastern Cape and eThekwini Municipality in KwaZulu-Natal also registered declines.
Data are also published for new and existing properties. For metropolitan areas, the price index for new properties witnessed an annual increase of 3,1% in March. This was higher than the 2,4% rise recorded for properties that were resold.
Five-year growth lacklustre in Johannesburg
The RPPI time series shows how prices have changed over a five-year period.2 Nationally, there was an increase of 23,8% since March 2019, an average annual increase of 4,8% (Figure 3). Western Cape is again in the lead. Property prices in the province increased by 35,5% over the same period. Northern Cape recorded the slowest growth, rising by 0,9%. Property prices in Gauteng increased by 16,4%, below the national average.
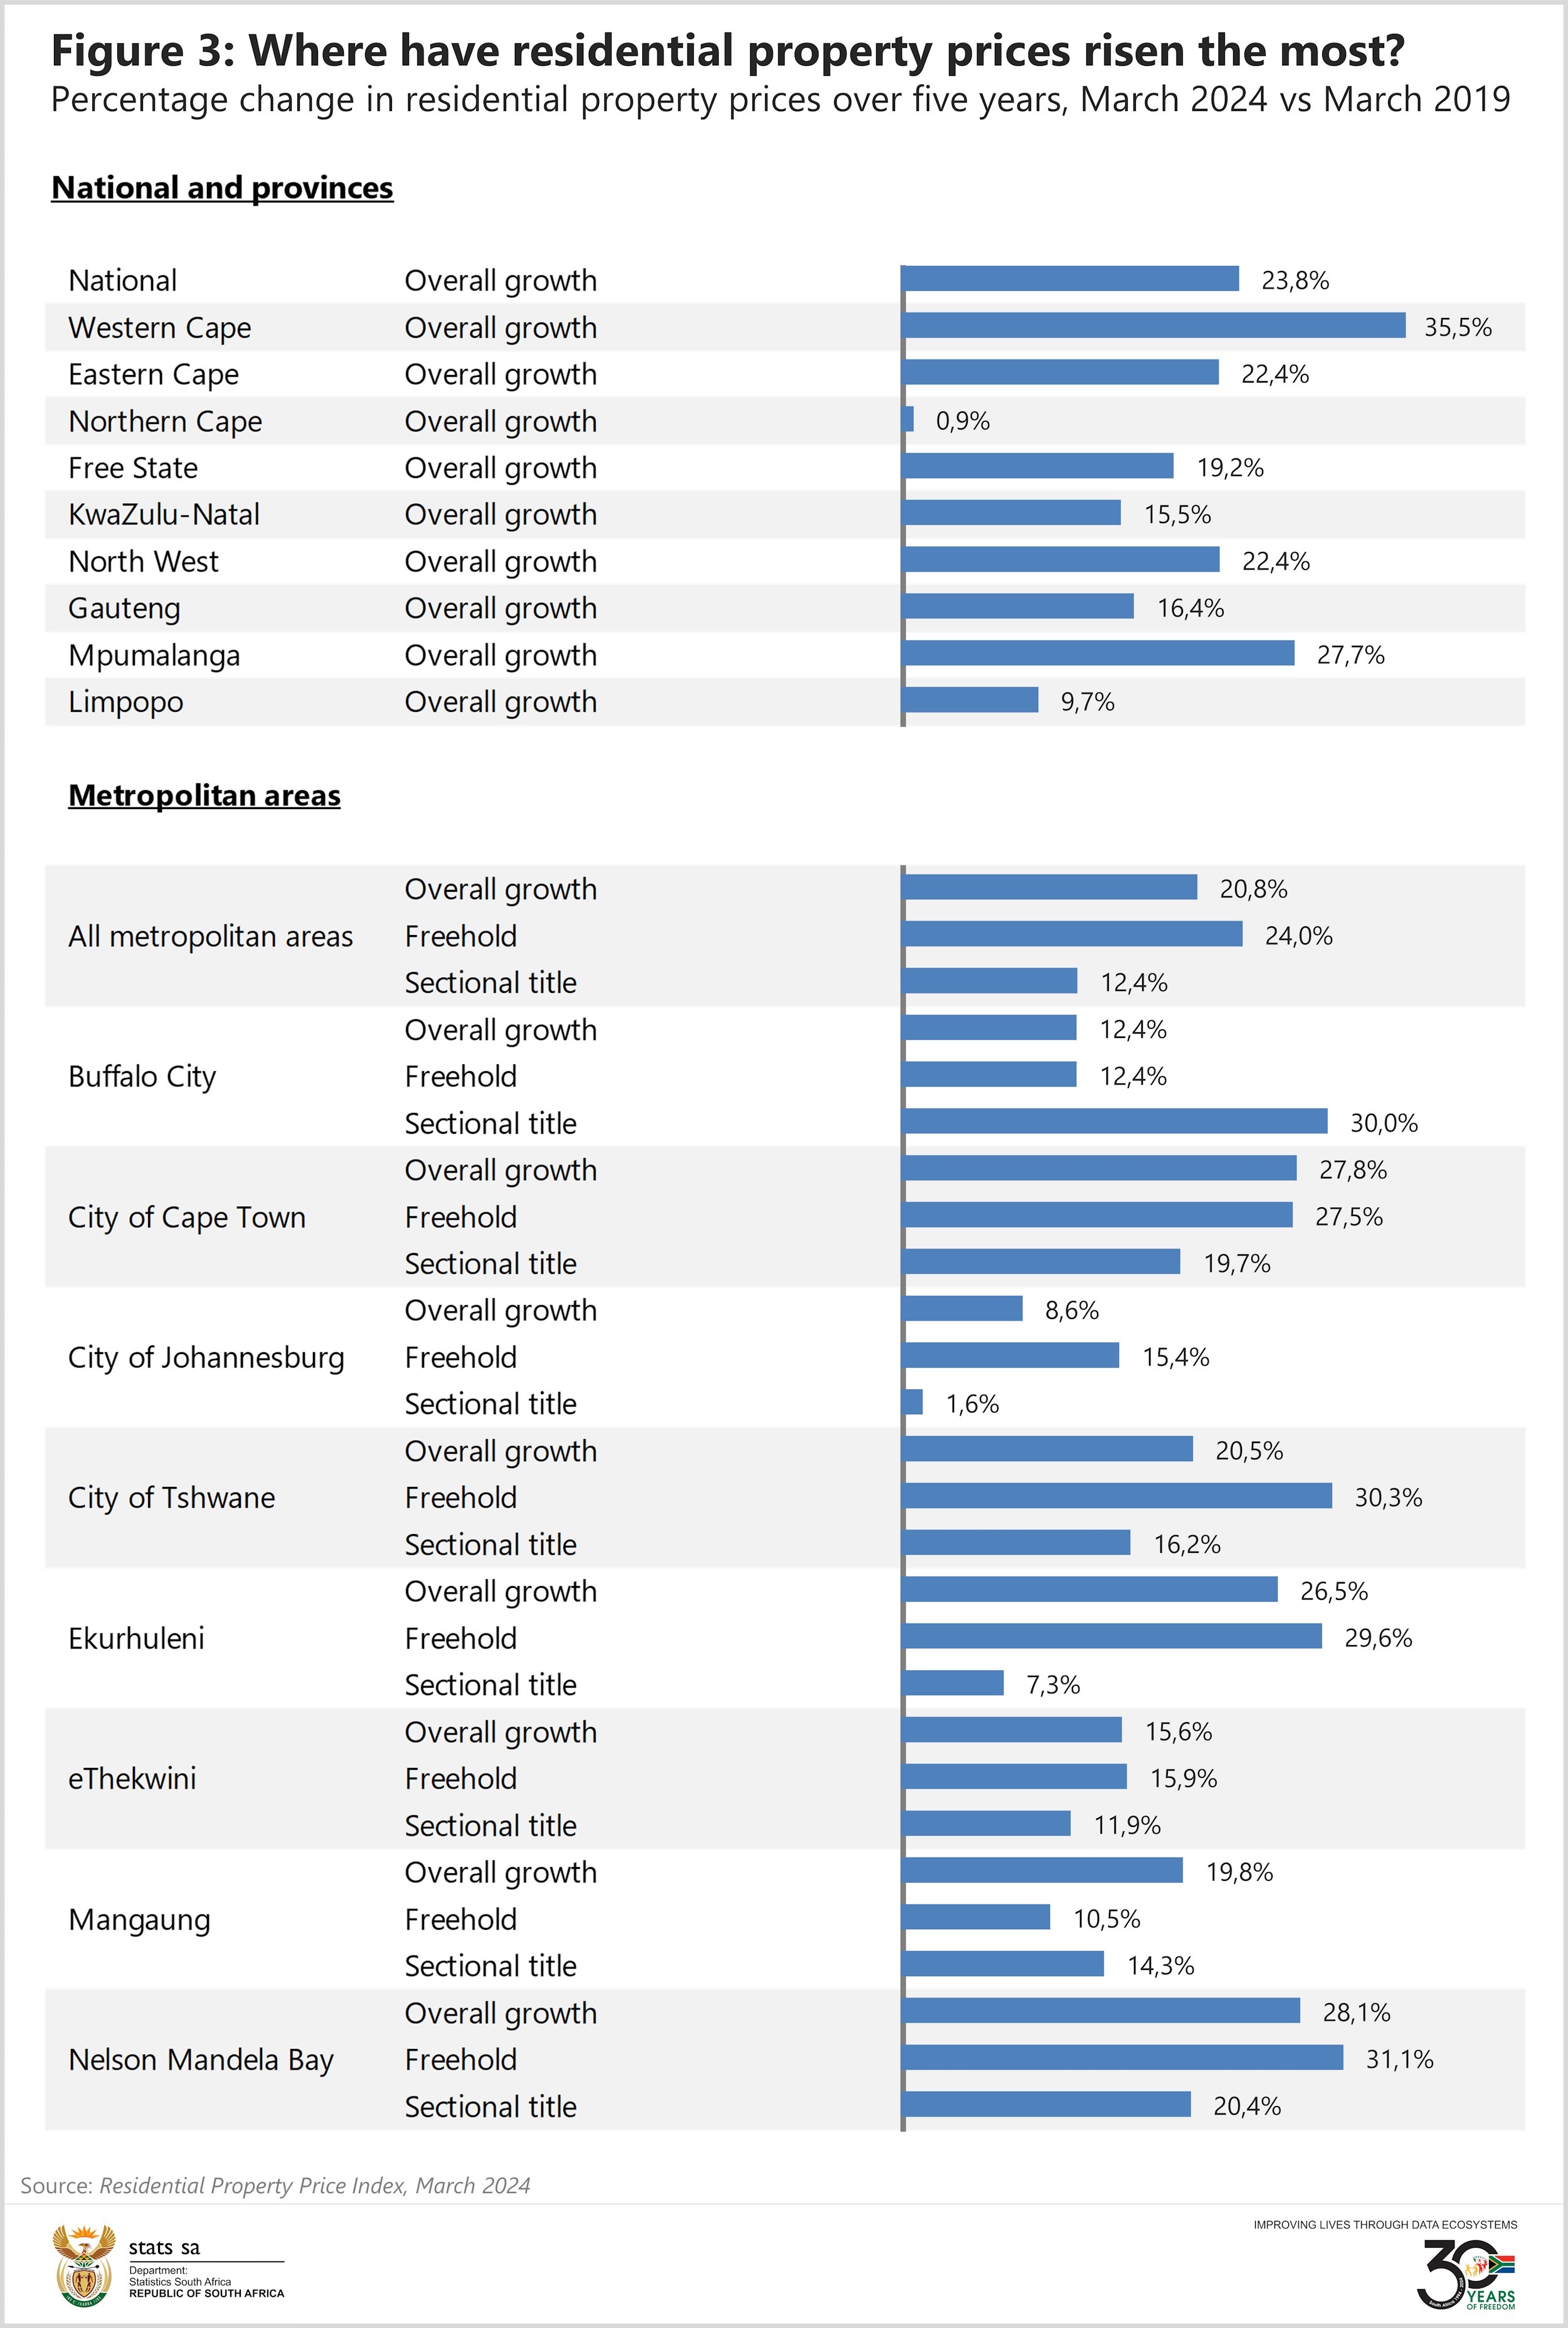
Freehold properties in Nelson Mandela Bay Municipality increased by a notable 31,1% in the five-year period, as did freehold properties in the City of Tshwane (up 30,3%) and sectional title properties in Buffalo City Metropolitan Municipality (up 30,0%). The City of Johannesburg has experienced a sluggish market, with overall growth rising by 8,6%.
For more information, download the March 2024 RPPI statistical release here.
1 Data for the RPPI are sourced from property transaction records housed at the Office of the Chief Registrar of Deeds (Deeds Office). The indices are calculated using a hedonic regression model and are further smoothed to reduce volatility. The Deeds Office dataset is updated regularly. To incorporate these updates, the RPPI is subject to revisions for 12 months. Details of the methodology can be found in the Residential Property Price Index: Sources and Methods, Report No. 01-60-00 (2024) document, available here for download. The RPPI is produced in partnership with the South African Reserve Bank (SARB) with support from the International Monetary Fund (IMF).
2 RPPI data are available from January 2010. A previous article, published here, provides insight into how the time series can be used.