
Consumer inflation slows in June
The annual change in the consumer price index (CPI) was 5,1% in June, down from 5,2% in May. Inflation has remained within the 5% to 6% range for the past 10 months.
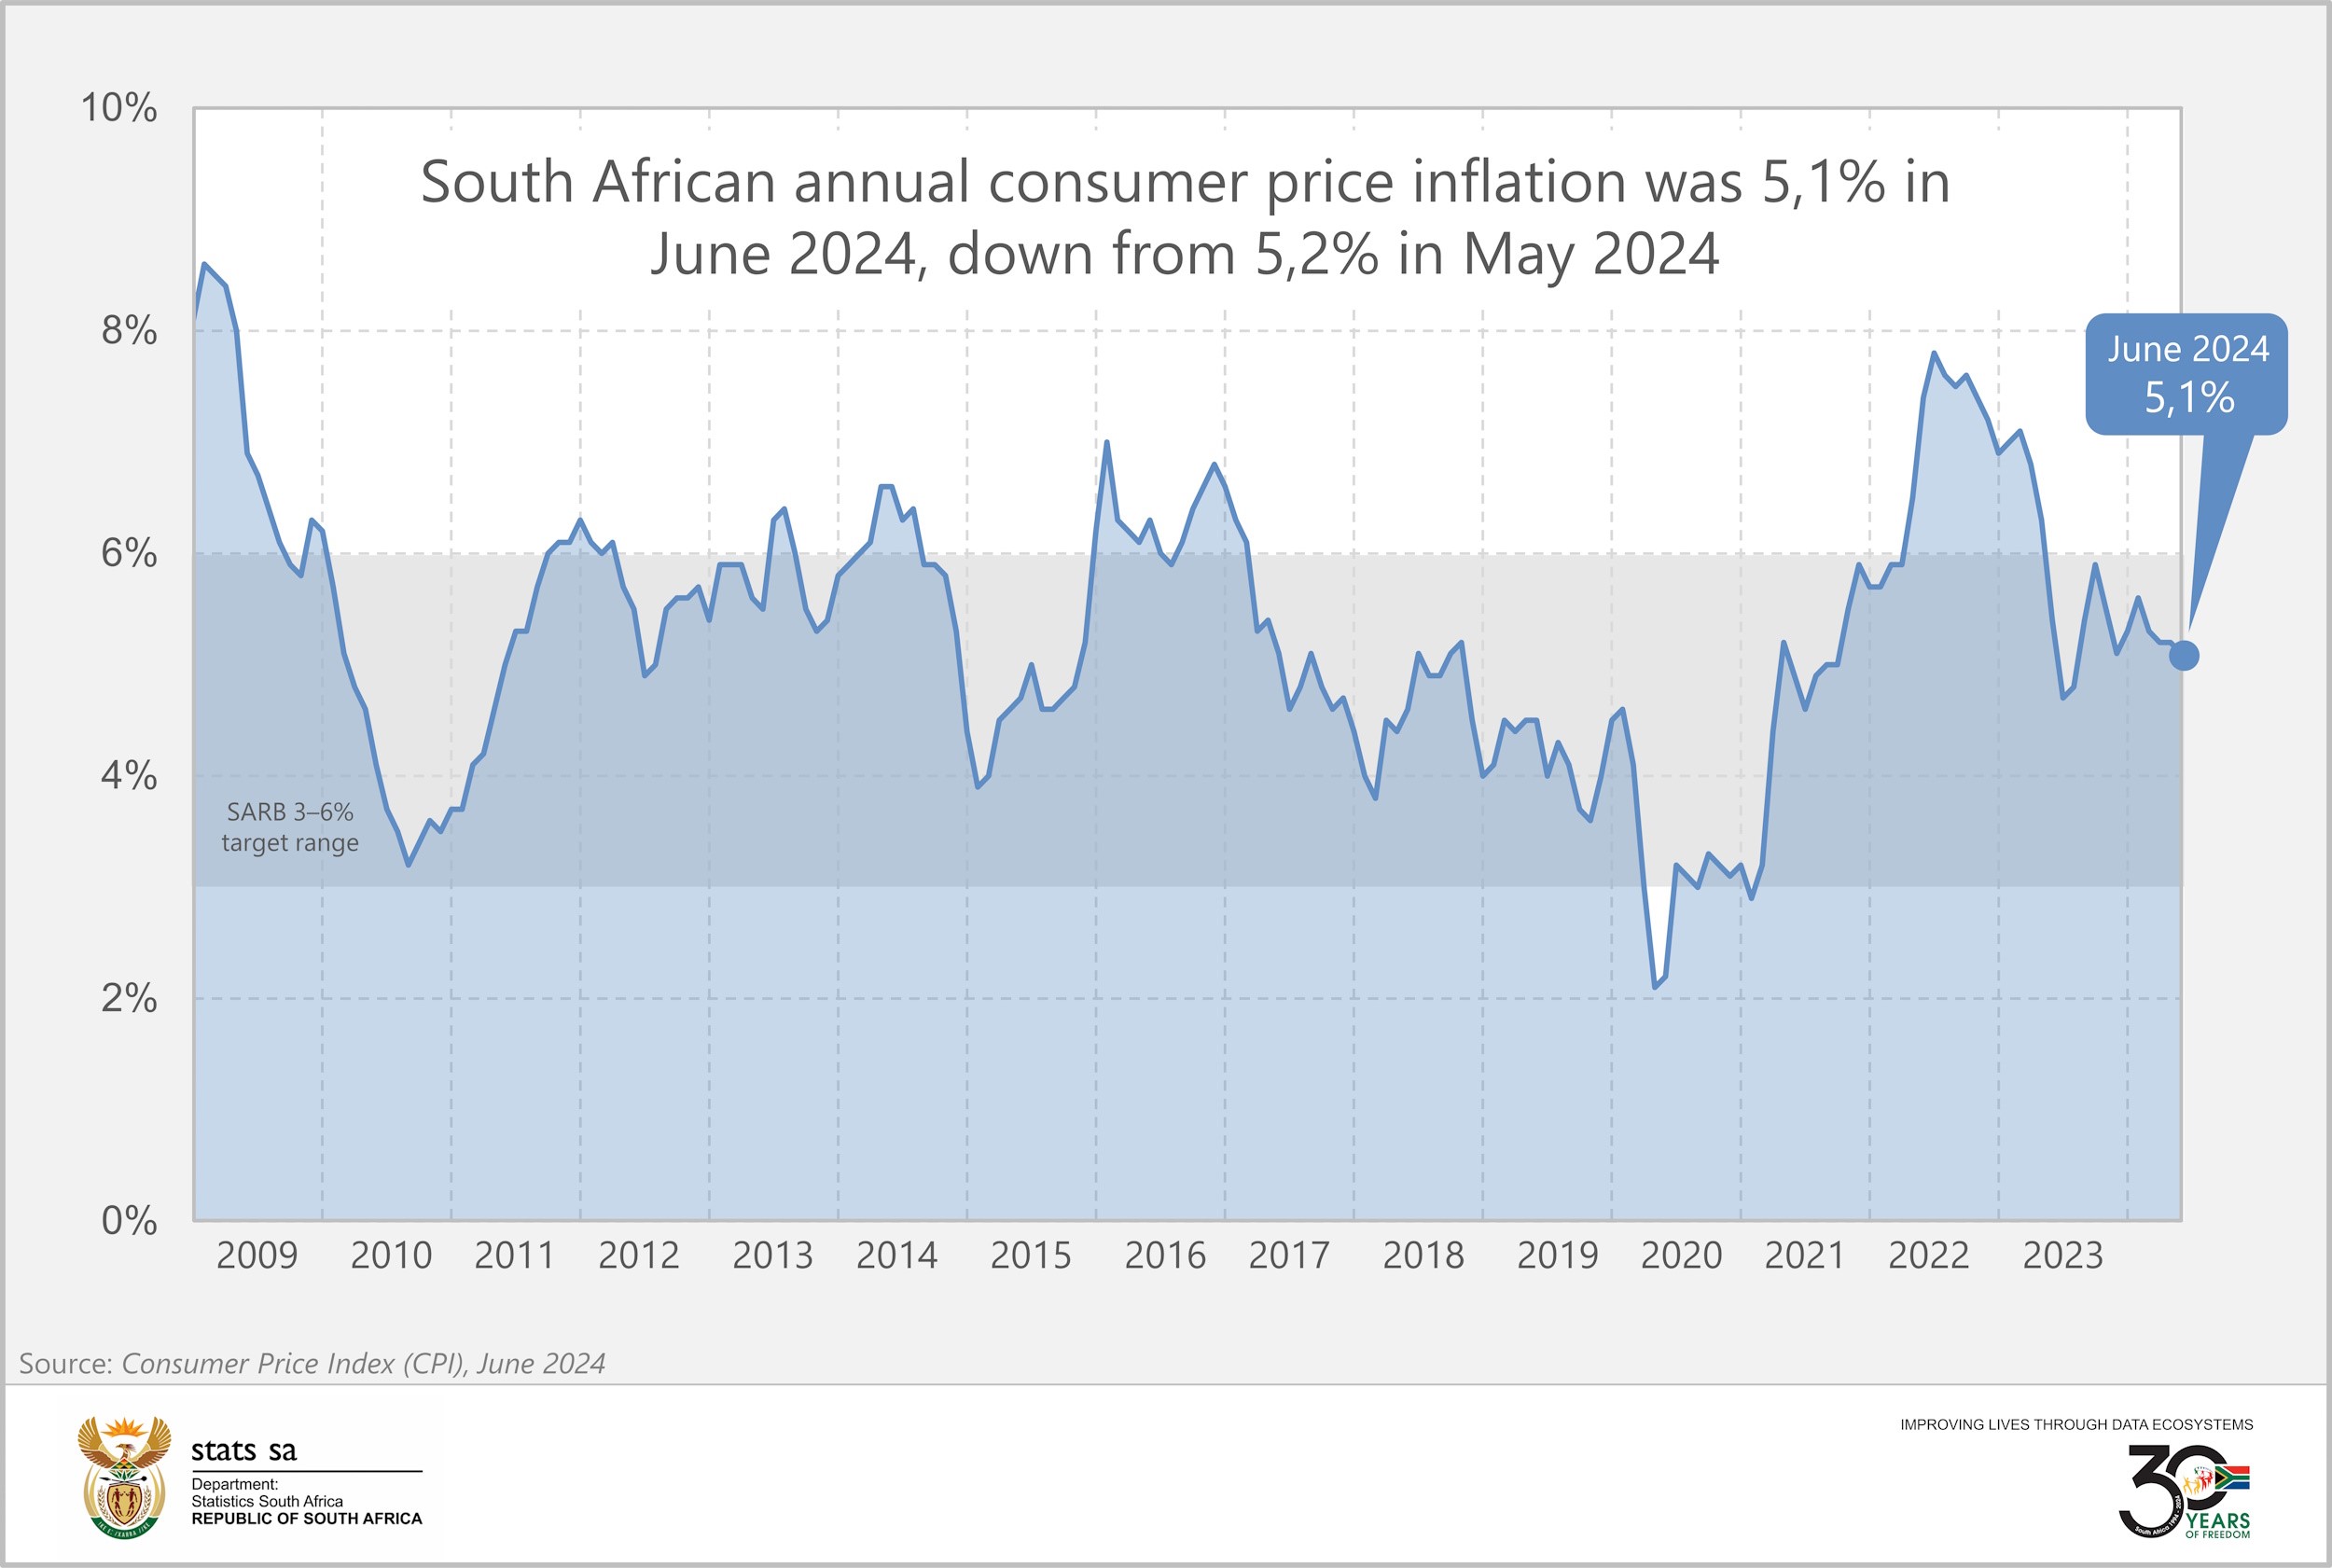
The monthly rate was 0,1% in June.
Annual food inflation the lowest in 45 months
After stalling at 4,7% in April and May, the annual rate for food & non-alcoholic beverages (NAB) edged lower to 4,6% in June. Food & NAB inflation has declined from its recent peak of 14,0% in March 2023. June’s reading is the lowest since September 2020 – 45 months ago at the peak of the COVID-19 lockdowns – when the rate was 3,8%.
Several food & NAB categories registered lower annual rates in June, including sugar, sweets & desserts; vegetables; fruit; milk, eggs & cheese; and fish. Inflation quickened, however, for hot beverages; bread & cereals; oils & fats; cold beverages; and meat.
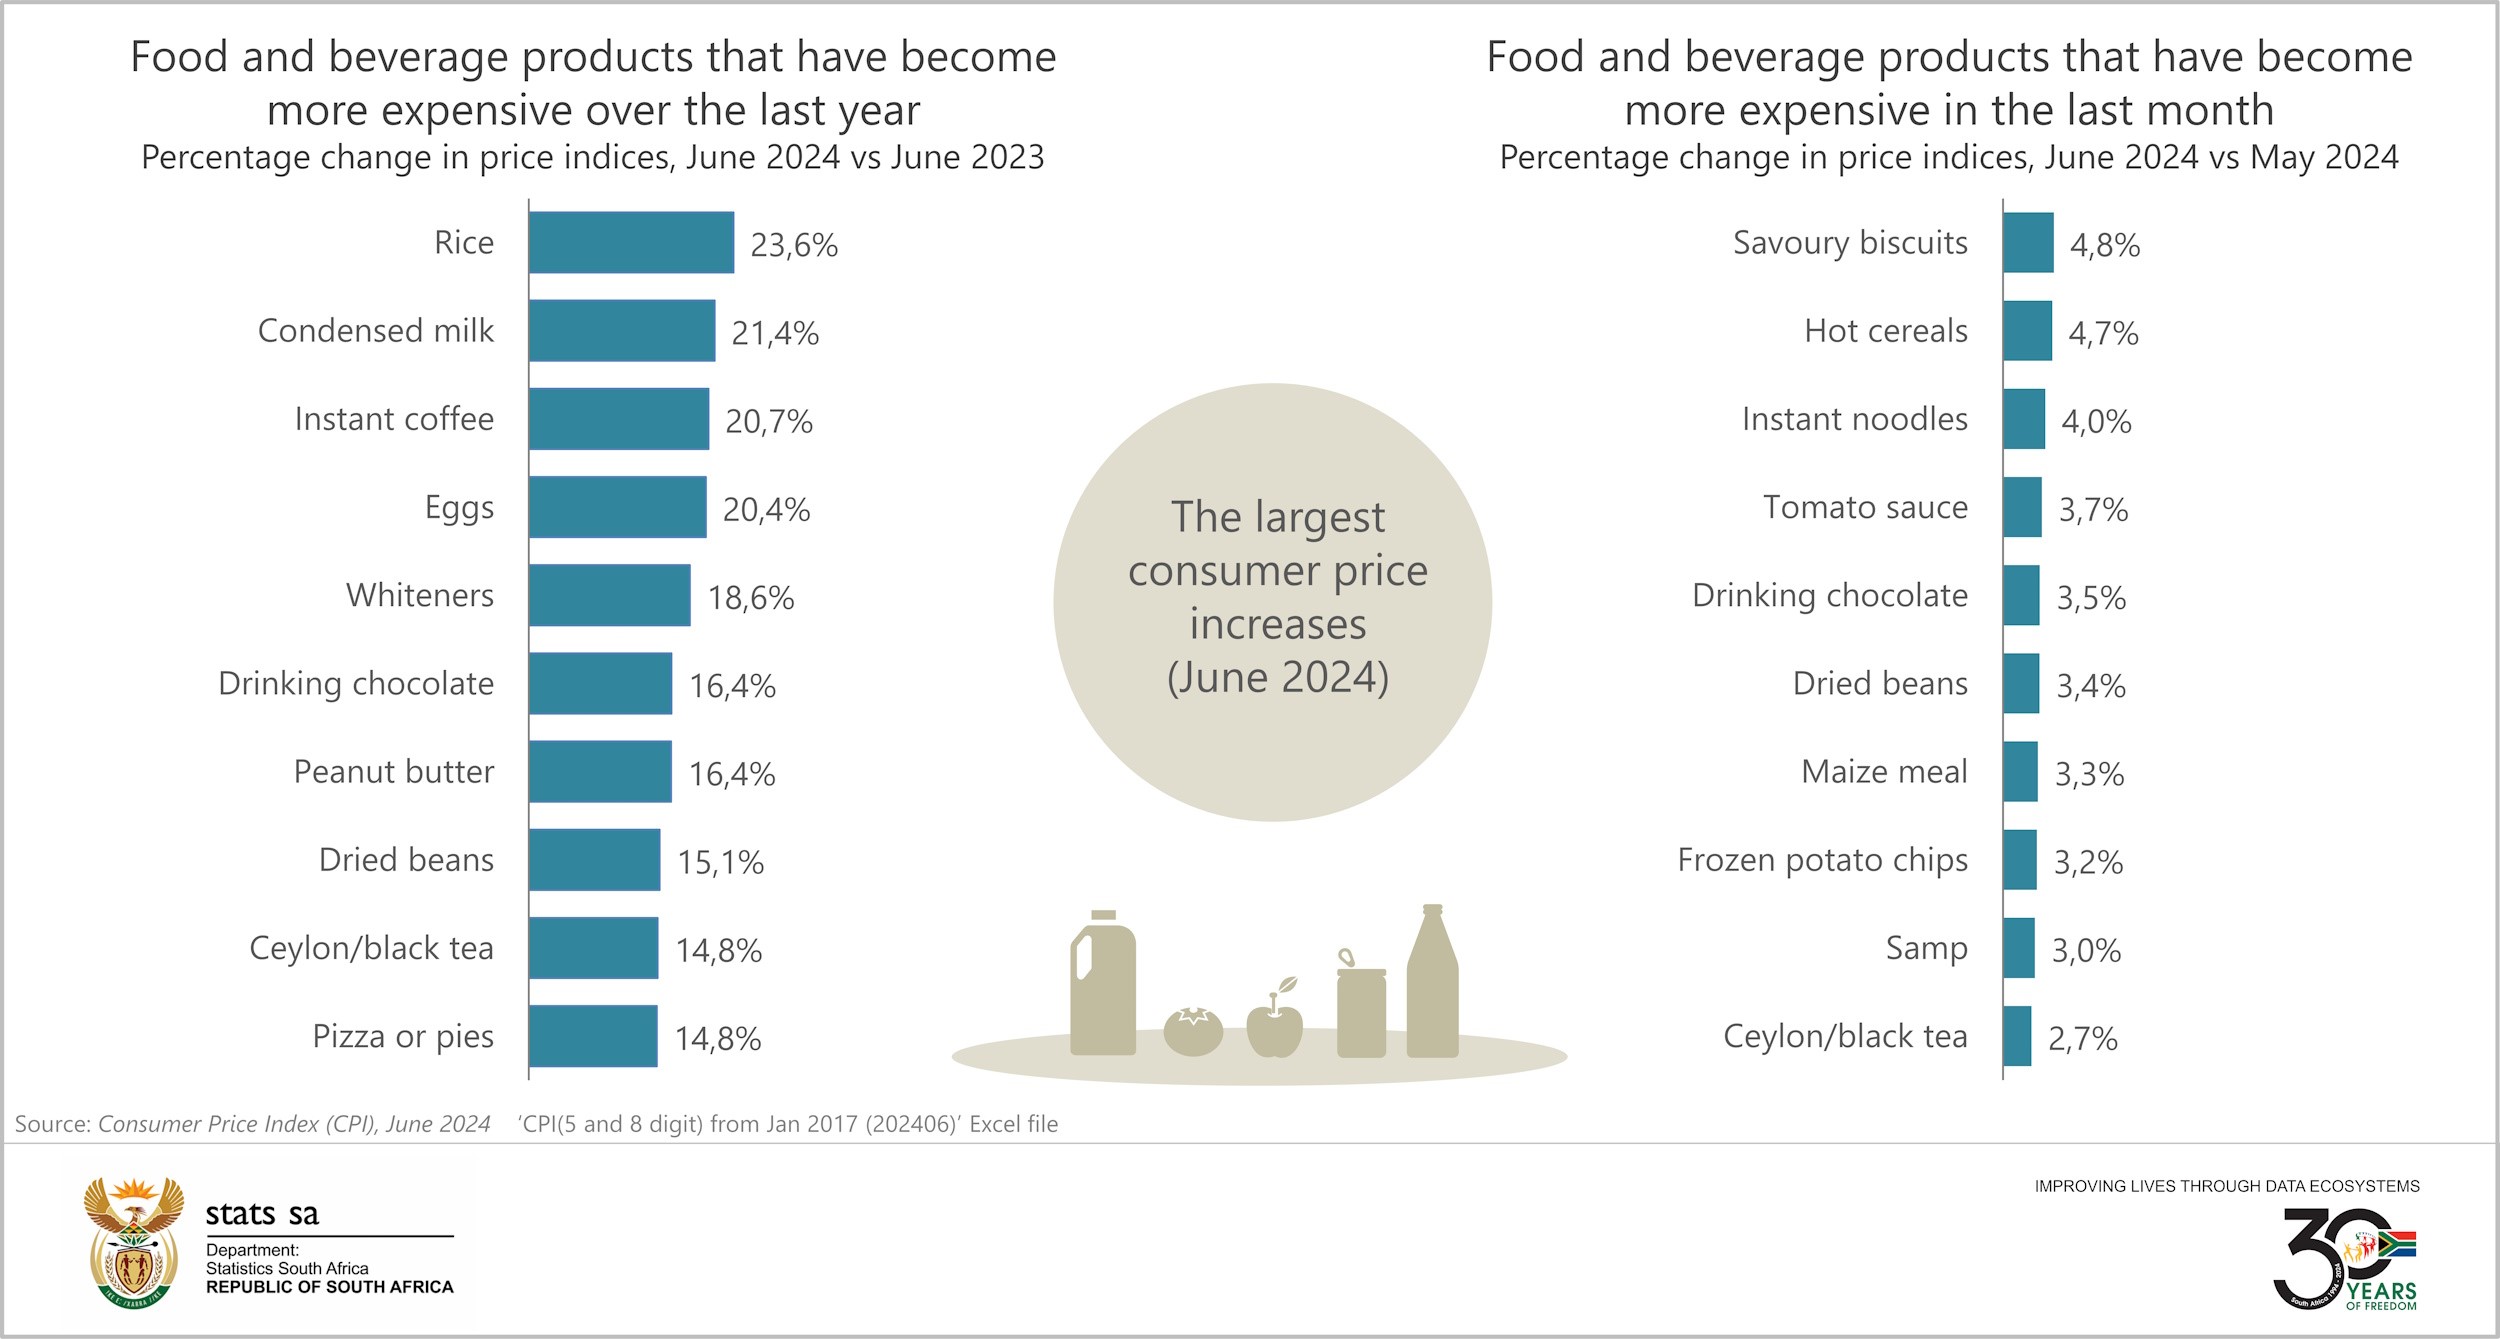
The annual rate for hot beverages steamed to 16,5% in June from 14,2% in May. The monthly change was 2,2%, driven by sharp price increases for drinking chocolate (up 3,5%), black tea (up 2,7%), instant coffee (up 2,2%) and rooibos tea (up 1,6%).
The annual rate for bread & cereals saw its first increase in 14 months, rising to 5,2% in June from 3,9% in May. The monthly rate was 1,5%, with notable increases for maize products such as maize meal (up 3,3%) and samp (up 3,0%). For some context, the producer price index (PPI) for final manufacturing, which measures prices at the factory gate, recorded a 7,2% monthly (4,6% annual) increase for maize products in May. Maize in the agriculture PPI increased by an annual 23,8%. PPIs are often leading indicators of the CPI, so the data suggest that elevated inflation for maize-based products is widespread.
The milk, eggs & cheese category has experienced six months of slower inflation. The rate for June was 7,3%, down from 14,5% in December 2023. Annual egg inflation recorded its seventh consecutive month of decline, cooling to 20,4%.
The graphs below show food and beverage products that recorded the most significant annual and monthly price increases in June.
Other notable price changes
Housing & utilities recorded an annual inflation rate of 5,5% in June, lower than 5,8% in May. Housing rentals are surveyed quarterly. Actual rentals increased by 0,8% in the second quarter of 2024 compared with the first quarter. Imputed rentals edged higher by 0,7% over the same period. Townhouses recorded the highest quarterly change at 1,5% (actual rentals) and 1,2% (imputed rentals). Domestic worker wages registered a quarterly rise of 1,6%.
Annual transport inflation cooled to 5,5% in June from 6,3% in May. New vehicle inflation slowed to 5,2% from a recent high of 8,4% in September 2023. Data from naamsa indicates that there is lower demand for new passenger vehicles, with sales declining by 9,0% year-on-year in June.1 Inflation for used vehicles was 3,0%, down from 3,7% in May.
Fuel prices dropped by 4,6% between May and June, taking the annual rate for fuel to 7,6% from 9,3%.
For more information, download the June 2024 CPI statistical release and Excel files with indices and average prices here. The archive is available here.
1 naamsa, 2024. naamsa releases June 2024 new vehicle sales statistics and congratulates the new cabinet in the government of national unity [Press release] (download here).
Similar articles are available on the Stats SA website and can be accessed here.
For a monthly overview of economic indicators and infographics, catch the latest edition of the Stats Biz newsletter here.